Top 12 Best Free Network Monitoring Tools for 2026
That aging UniFi gear in your Greenwood office park? It’s not just a nuisance; it’s a silent profit-killer. Every minute your network is down or sluggish costs real money, up to $9,000 per minute for some businesses. This is 'wasted tech time' that could be billable hours. Many Johnson County business owners assume fixing this requires a huge budget, but what if you could diagnose and solve these problems without spending a dime on software? We'll show you how.
This isn't a theoretical list. In our 17 years of local service across the I-65 corridor, we've deployed and managed these exact tools to stabilize networks, meet compliance standards like HIPAA and CMMC, and give local decision-makers the visibility they need. We're talking about the best free network monitoring tools that put you in control. Knowing your network is slow is one thing; proving why it's slow is another. These tools can pinpoint the exact cause, whether it's a failing switch, a misconfigured firewall, or something more obscure. For instance, when your monitoring tools highlight performance bottlenecks or connectivity issues, you might need to learn how to diagnose and fix DNS server problems to restore optimal operation.
This guide is designed for practical use. We’ll cut through the marketing fluff and give you our honest take on 12 powerful, free options. Each entry includes screenshots, direct download links, pros, cons, and the ideal use case for businesses just like yours. We’ll even tell you when a tool is overkill for your needs or when it’s the perfect starting point before you consider a managed solution. Before you call your ISP, let's explore these tools to get you the data you need to stop wasting money and start fixing things.
1. Zabbix
If you're ready to graduate from basic ping tests to a serious, all-in-one monitoring command center, Zabbix is your answer. It’s a completely free, open-source platform that brings enterprise-grade monitoring capabilities down to the SMB level. Forget juggling five different tools; Zabbix handles everything from network devices and servers to cloud instances and applications in a single, self-hosted dashboard. This is the tool we deploy for Johnson County businesses that need deep visibility without the per-device licensing costs that kill budgets.

What makes it one of the best free network monitoring tools is its sheer power and flexibility. It uses agent-based and agentless monitoring (SNMP, IPMI, JMX) and features robust auto-discovery to map your entire network automatically. The alerting system is incredibly detailed, allowing you to create complex escalation rules and maintenance windows to avoid false alarms at 3 AM.
Finchum's Take on Zabbix
Zabbix is a beast. Its greatest strength is its scalability-it can monitor a small Greenwood office or a massive enterprise network with thousands of devices. The trade-off is its complexity. Getting it set up correctly requires some real technical know-how to avoid a flood of "alert noise."
Ideal Use Case: Perfect for businesses that have outgrown simpler tools and need a single source of truth for their entire IT infrastructure, from on-prem servers to cloud services. It's especially useful for organizations needing to track performance metrics for compliance purposes, like HIPAA or CMMC.
Implementation & Support: Initial setup can be tricky. You need to provision a server (Linux is typical), install the Zabbix server and database, and then configure templates and triggers. To get the most out of it while avoiding common pitfalls, a guided setup is a smart move. After all, a monitoring tool should reduce downtime, not create more work. For a deeper dive into what a solid monitoring strategy looks like, check out our guide on the 10 best practices for network monitoring your Indiana business needs in 2026.
The team at Finchum Fixes IT can handle the entire Zabbix deployment, from server setup to fine-tuning alerts, ensuring you get actionable insights from day one.
Pros:
- Completely Free: No license limits on devices, users, or metrics.
- Extremely Scalable: Grows with your business from a small server rack to a multi-site enterprise.
- Massive Community: Decades of development mean extensive documentation and community support.
Cons:
- Steep Learning Curve: Not a plug-and-play solution; requires significant technical expertise.
- Requires Tuning: Initial setup needs careful configuration to prevent a storm of irrelevant alerts.
Get It Here: https://www.zabbix.com/
2. Nagios Core
Nagios Core is the old guard of network monitoring, the foundational engine upon which countless IT careers have been built. It’s a lean, powerful, and completely free monitoring solution that operates on a simple principle: use a lightweight core and extend its functionality with plugins. For businesses in the Indy metro area that want total control and don't mind getting their hands dirty with configuration files, Nagios provides an incredibly robust framework for watching hosts, services, and network devices.
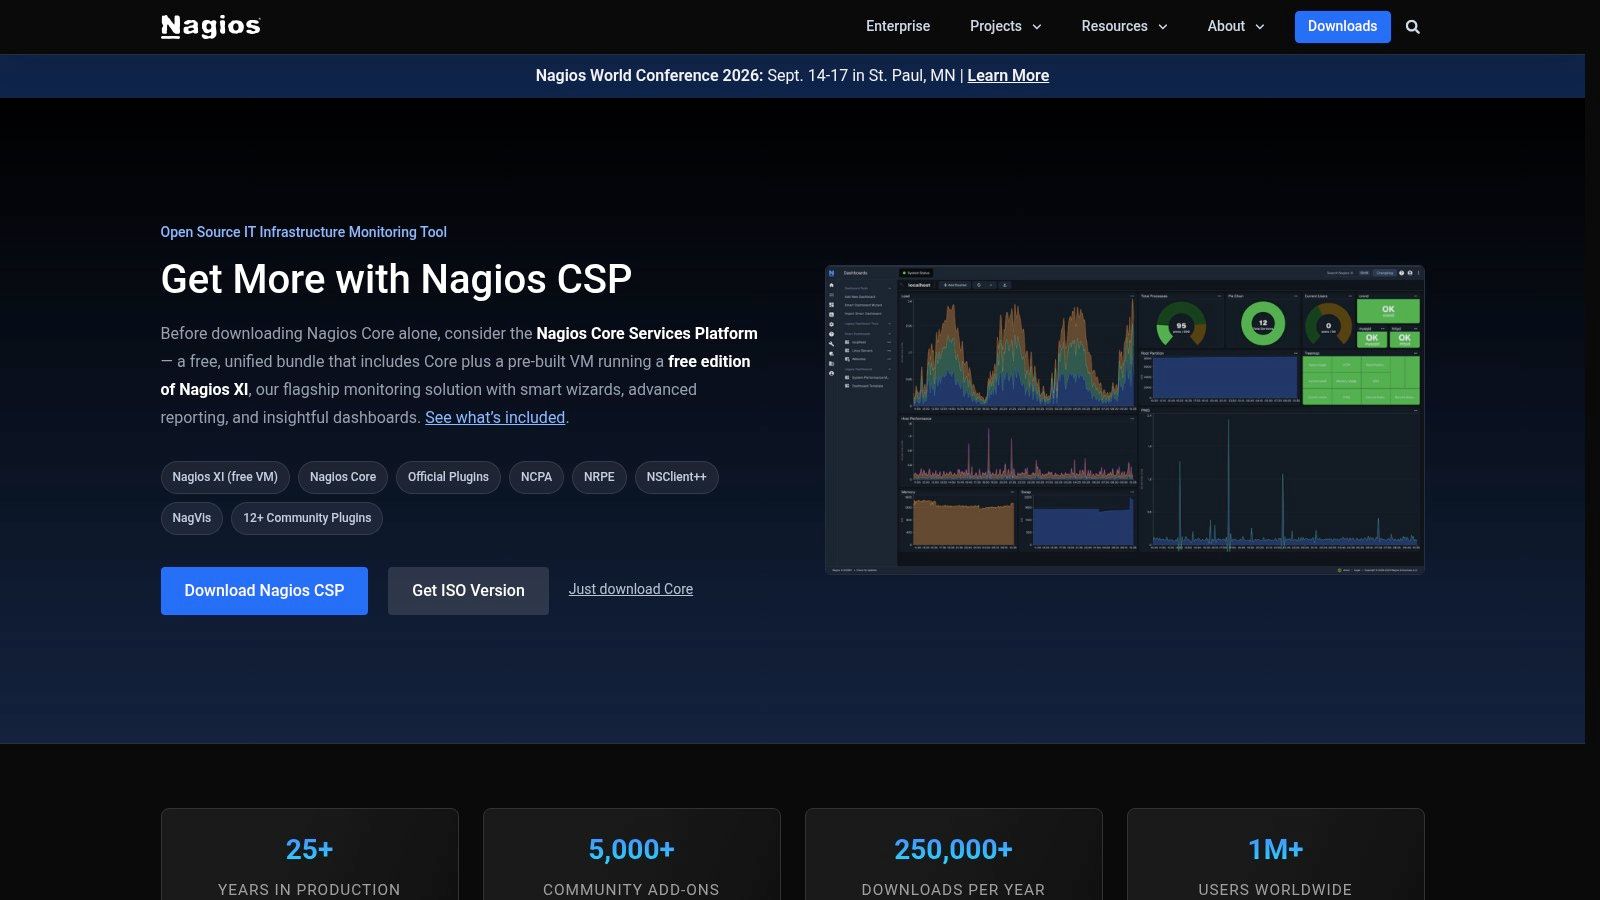
Its status as one of the best free network monitoring tools comes from its massive plugin ecosystem. With thousands of community-developed plugins, you can monitor virtually anything, from standard ICMP pings and SNMP checks to the temperature of a specific server CPU. The event handling and alerting system is rock-solid, forming the backbone of a reliable network security strategy. You can learn more about what network security is and why it matters for Indiana businesses to understand its importance.
Finchum's Take on Nagios Core
Nagios is a classic for a reason. It's stable, resource-efficient, and infinitely customizable. Its strength is its simplicity-if you can write a script, you can create a Nagios check. The downside is that its default web interface is very basic, and everything is manual. You're building your monitoring system from the ground up.
Ideal Use Case: Best for tech-savvy teams who value granular control and extensibility over a polished, out-of-the-box experience. It’s perfect for monitoring specific, critical services in a Greenwood data center or for a company that has unique hardware requiring custom monitoring scripts.
Implementation & Support: Setup involves installing the core engine on a Linux server and then manually defining every host, service, and command in text-based configuration files. While this offers ultimate flexibility, it’s also time-consuming and prone to human error. A professional setup can ensure your configuration is logical, scalable, and correctly integrated with the right plugins for your environment.
Pros:
- Mature Ecosystem: Decades of development mean extensive documentation and thousands of plugins.
- Very Lightweight: The core engine has a tiny footprint and runs efficiently on minimal hardware.
- Highly Extensible: Easy to script and integrate custom checks for any device or service.
Cons:
- Manual Configuration: Lacks auto-discovery; every device and check must be configured by hand.
- Basic Interface: The default GUI is dated and lacks the reporting features of modern suites without add-ons.
Get It Here: https://www.nagios.org/nagios-core/
3. Icinga
If you’ve ever battled with Nagios and wished for something with the same power but built for the modern IT world, Icinga is your answer. It began as a fork of Nagios but has since evolved into a completely distinct, powerful monitoring platform. Icinga is designed for distributed environments, making it ideal for Johnson County businesses with multiple locations or a mix of on-prem and cloud infrastructure that need to be monitored from a single pane of glass.
What makes Icinga one of the best free network monitoring tools is its modern architecture and flexibility. It boasts a powerful REST API for easy integration with DevOps tools like Ansible or Puppet, a cleaner web interface than its predecessor, and a robust configuration language. This makes it a great choice for teams that want to automate their monitoring configuration and treat "monitoring as code."
Finchum's Take on Icinga
Icinga strikes a great balance. It has the DNA of a traditional, rock-solid monitoring tool but with the API and UI that a modern IT team expects. It’s far more approachable than Nagios Core but still requires solid Linux skills to deploy correctly and manage effectively.
Ideal Use Case: Excellent for businesses that need distributed monitoring across multiple sites or hybrid cloud environments. It's a natural fit for organizations with a DevOps culture that want to automate their infrastructure management and integrate monitoring directly into their CI/CD pipelines.
Implementation & Support: Setup involves configuring the Icinga Core, its database backend, and the Icinga Web 2 interface. While more straightforward than some rivals, getting the distributed monitoring and high-availability features working requires careful planning. A misconfiguration can leave you with blind spots in your network, which is why a professional setup is key. Ensuring your monitoring tool is secure is just as important as what it's watching; you can read our top 10 best network security practices for Indianapolis businesses for more on that front.
The Finchum Fixes IT team is experienced in deploying Icinga for complex environments, ensuring your monitoring is both powerful and reliable from day one.
Pros:
- Modern UI & API: A significant improvement over classic tools, with a clean interface and powerful REST API.
- Distributed Architecture: Built from the ground up to monitor complex, geographically separate networks.
- Strong Community & Plugins: Benefits from a large ecosystem of plugins via the Icinga Exchange.
Cons:
- Requires Linux Expertise: Best suited for teams comfortable working in a Linux command-line environment.
- More Complex than Simple Tools: Has more moving parts than a basic "ping and pray" solution.
Get It Here: https://icinga.com/
4. Prometheus + Blackbox exporter
If your business lives and breathes in the cloud-native world, Prometheus is your pulse. Originally built at SoundCloud and now a cornerstone of the Cloud Native Computing Foundation (CNCF), Prometheus is the de facto standard for monitoring modern, dynamic environments like Kubernetes. By itself, it scrapes metrics from applications and infrastructure. But when you pair it with the Blackbox exporter, it transforms into a powerful network endpoint prober. This combination is how we help our downtown Indy tech hub clients monitor service uptime and latency with surgical precision.
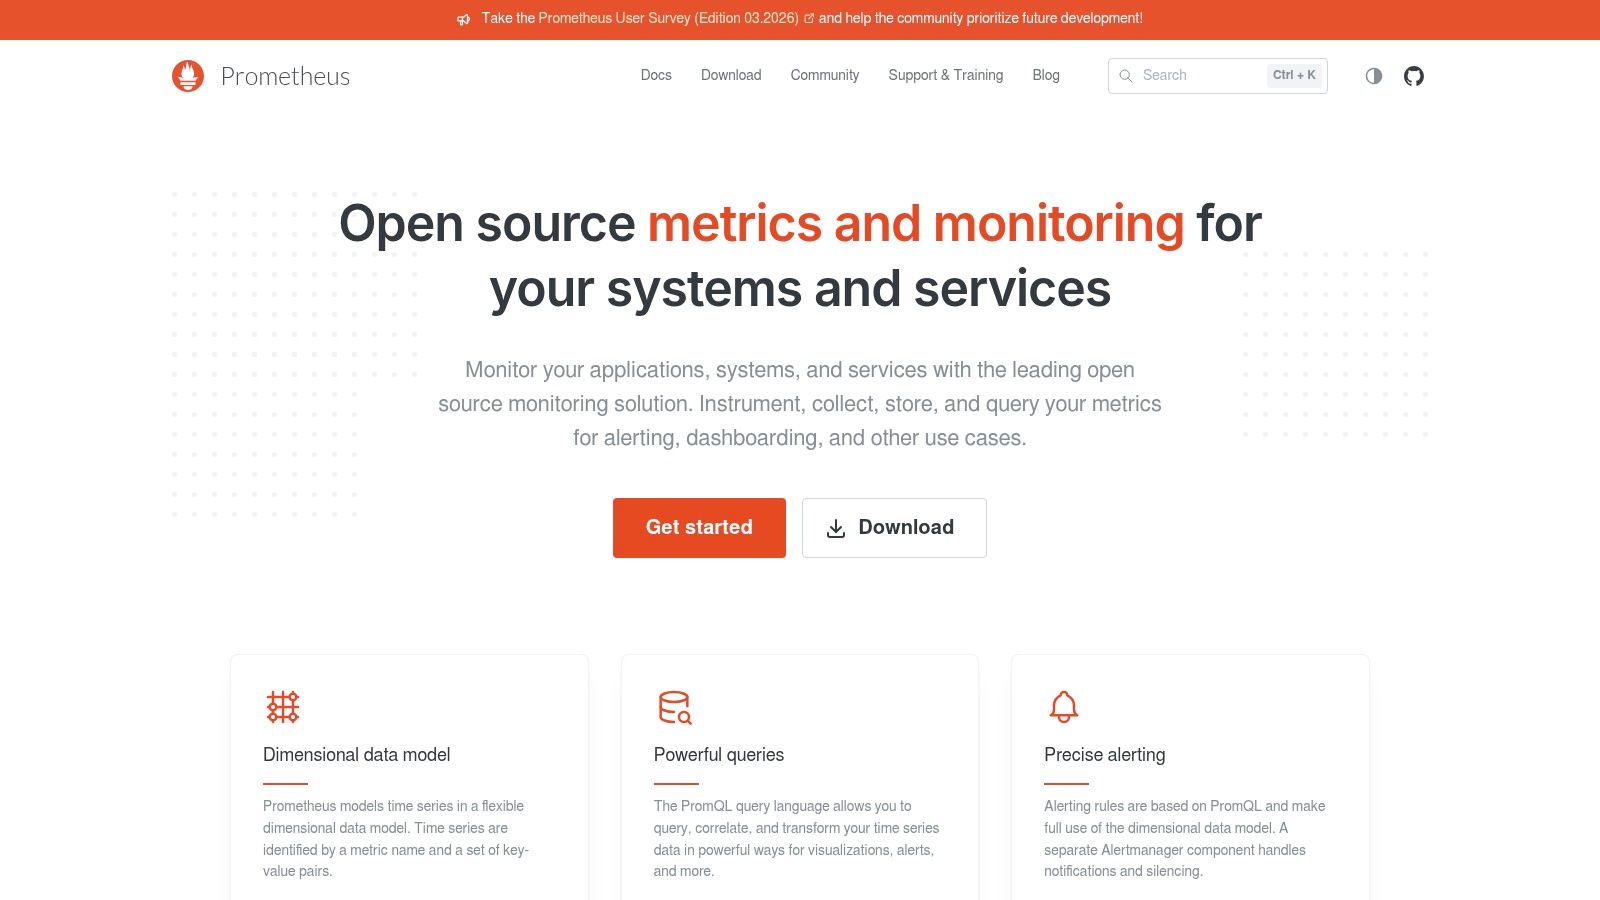
What makes this duo one of the best free network monitoring tools is its efficiency with time-series data. The Blackbox exporter can probe endpoints using ICMP, TCP, HTTP, and DNS, giving you detailed metrics on availability and response times. Its pull-based model and powerful query language (PromQL) are perfect for analyzing trends and diagnosing issues in distributed systems.
Finchum's Take on Prometheus + Blackbox exporter
Prometheus is built for developers and DevOps teams. Its strength lies in monitoring services, not just devices. It thinks in terms of 'is my API responding correctly?' rather than 'what is the CPU temperature of this switch?' The configuration-as-code approach is brilliant for automated environments but can be a headache for traditional IT admins used to GUI setups.
Ideal Use Case: Excellent for cloud-native businesses, software development shops, and any organization using microservices or containerized applications. It's the go-to for monitoring API endpoints, website uptime, and the health of distributed services.
Implementation & Support: Deployment involves running the Prometheus server and configuring it to "scrape" the Blackbox exporter, which is then aimed at your network targets. While powerful, getting the YAML configurations right is critical. You'll also need a separate tool like Grafana for creating dashboards, as Prometheus's built-in UI is for querying, not visualization.
The Finchum Fixes IT team can integrate a Prometheus/Grafana stack into your CI/CD pipeline, ensuring your monitoring scales right alongside your applications.
Pros:
- Cloud-Native Design: Perfectly suited for modern, dynamic infrastructures like Kubernetes.
- Highly Efficient: Optimized for collecting and querying time-series metrics.
- Massive Ecosystem: A huge library of exporters allows it to monitor almost anything.
Cons:
- Requires Grafana: Lacks a built-in, user-friendly dashboarding solution.
- Configuration-as-Code: Can be complex for those unfamiliar with YAML and a DevOps mindset.
Get It Here: https://prometheus.io/
5. LibreNMS
If your main goal is getting a handle on a mix of network gear from different vendors, LibreNMS is a fantastic starting point. It's a community-driven, open-source tool that leans heavily on SNMP (Simple Network Management Protocol) to automatically discover, graph, and alert on everything from switches and routers to wireless access points. For a Franklin business with a collection of Cisco, UniFi, and other hardware, LibreNMS provides a fast path to visibility without vendor lock-in or licensing fees.
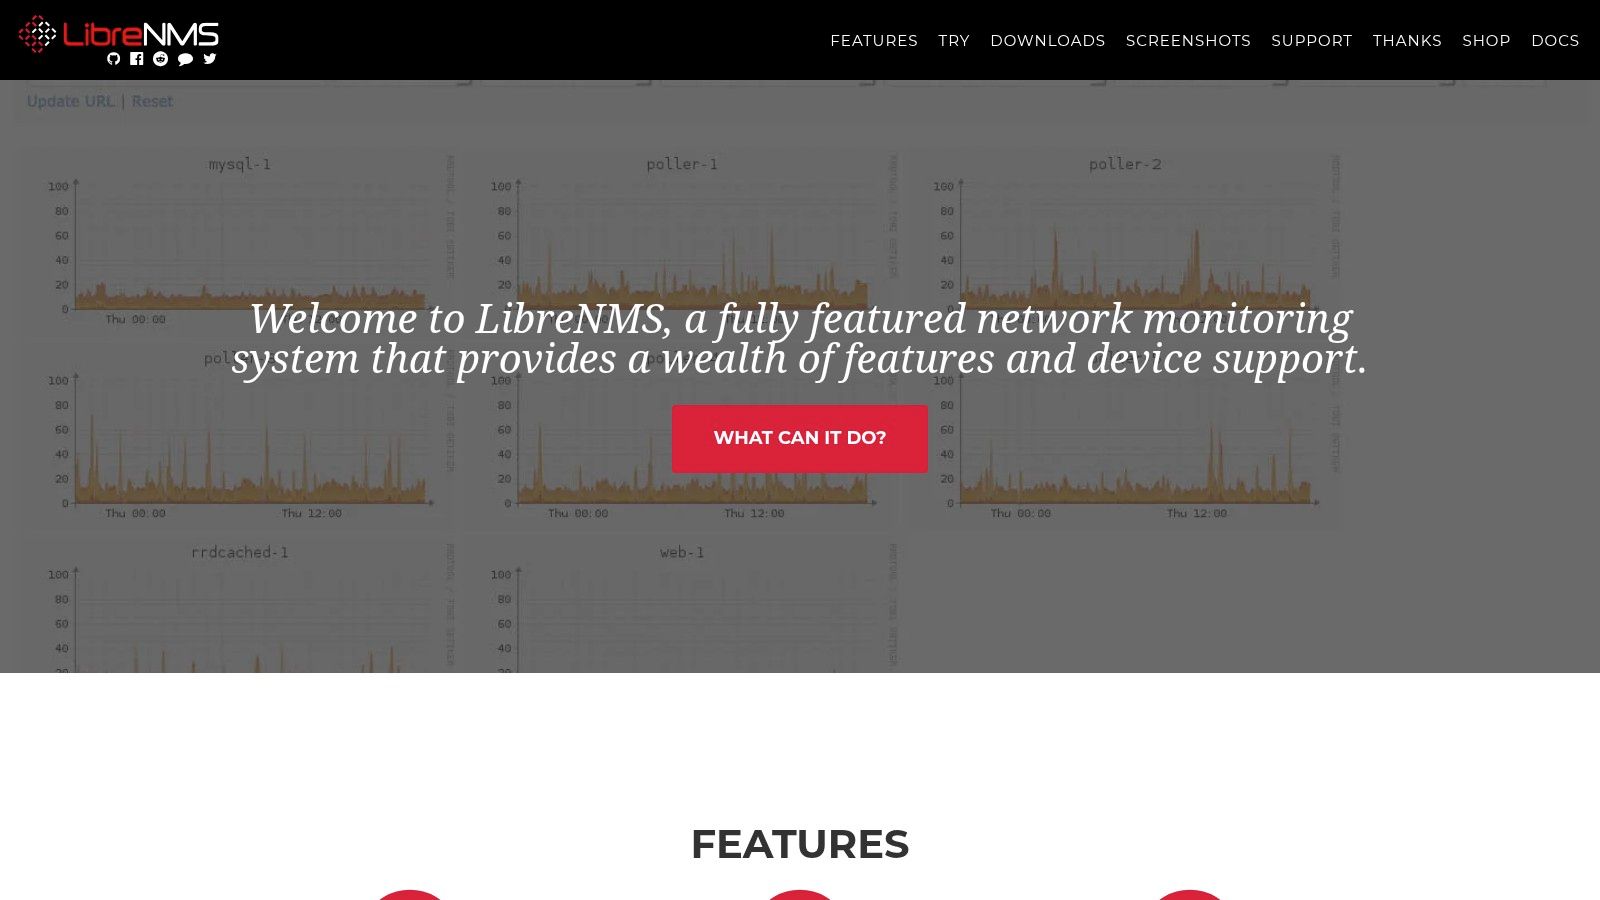
As one of the best free network monitoring tools for multi-vendor environments, its power comes from its auto-discovery features. Using protocols like CDP, LLDP, and BGP, it builds a map of your network, showing device health, interface utilization, and even environmental sensor data. Its alerting system is solid, with configurable rules that can integrate with syslog and traps to notify you of issues before they cause downtime.
Finchum's Take on LibreNMS
LibreNMS is the quick-win tool for network visibility. Its strength is how rapidly you can get it to discover and graph your devices, provided SNMP is set up correctly. It's less of an all-in-one platform like Zabbix and more of a dedicated network hardware monitor.
Ideal Use Case: Perfect for small to mid-sized businesses that need detailed monitoring of their network infrastructure (switches, routers, firewalls, APs) from multiple vendors. It's a great fit if you're not ready for a full-blown server and application monitoring suite but need more than basic ping checks.
Implementation & Support: Setup is straightforward if you're comfortable with a Linux environment. It runs on a standard LAMP stack, and the documentation is excellent. The key is ensuring all your network devices have SNMP enabled and configured correctly. Our team can help you properly roll out LibreNMS as part of a complete IT infrastructure management strategy to turn raw data into meaningful business insights.
Finchum Fixes IT can configure your network devices and deploy a LibreNMS server, ensuring you have clear visibility into your network’s health and performance.
Pros:
- Fast Multi-Vendor Discovery: Quickly identifies and monitors a wide range of network hardware.
- Active Community: Backed by a strong open-source community with frequent updates and new device support.
- Completely Free: No device limits or hidden costs.
Cons:
- SNMP Dependent: Its effectiveness is tied to how well SNMP is implemented across your network.
- Resource Intensive: Can be heavier on system resources than simple single-host metric tools.
Get It Here: https://www.librenms.org/
6. OpenNMS Horizon
When your network monitoring needs grow beyond simple up/down alerts and you require enterprise-level functionality without the enterprise-level price tag, OpenNMS Horizon enters the picture. This is a seriously feature-rich, open-source platform designed for deep visibility. It excels at service assurance, meaning it doesn't just tell you a switch is offline; it helps you understand the business services impacted, a critical function for any Johnson County business where downtime hits the bottom line hard.
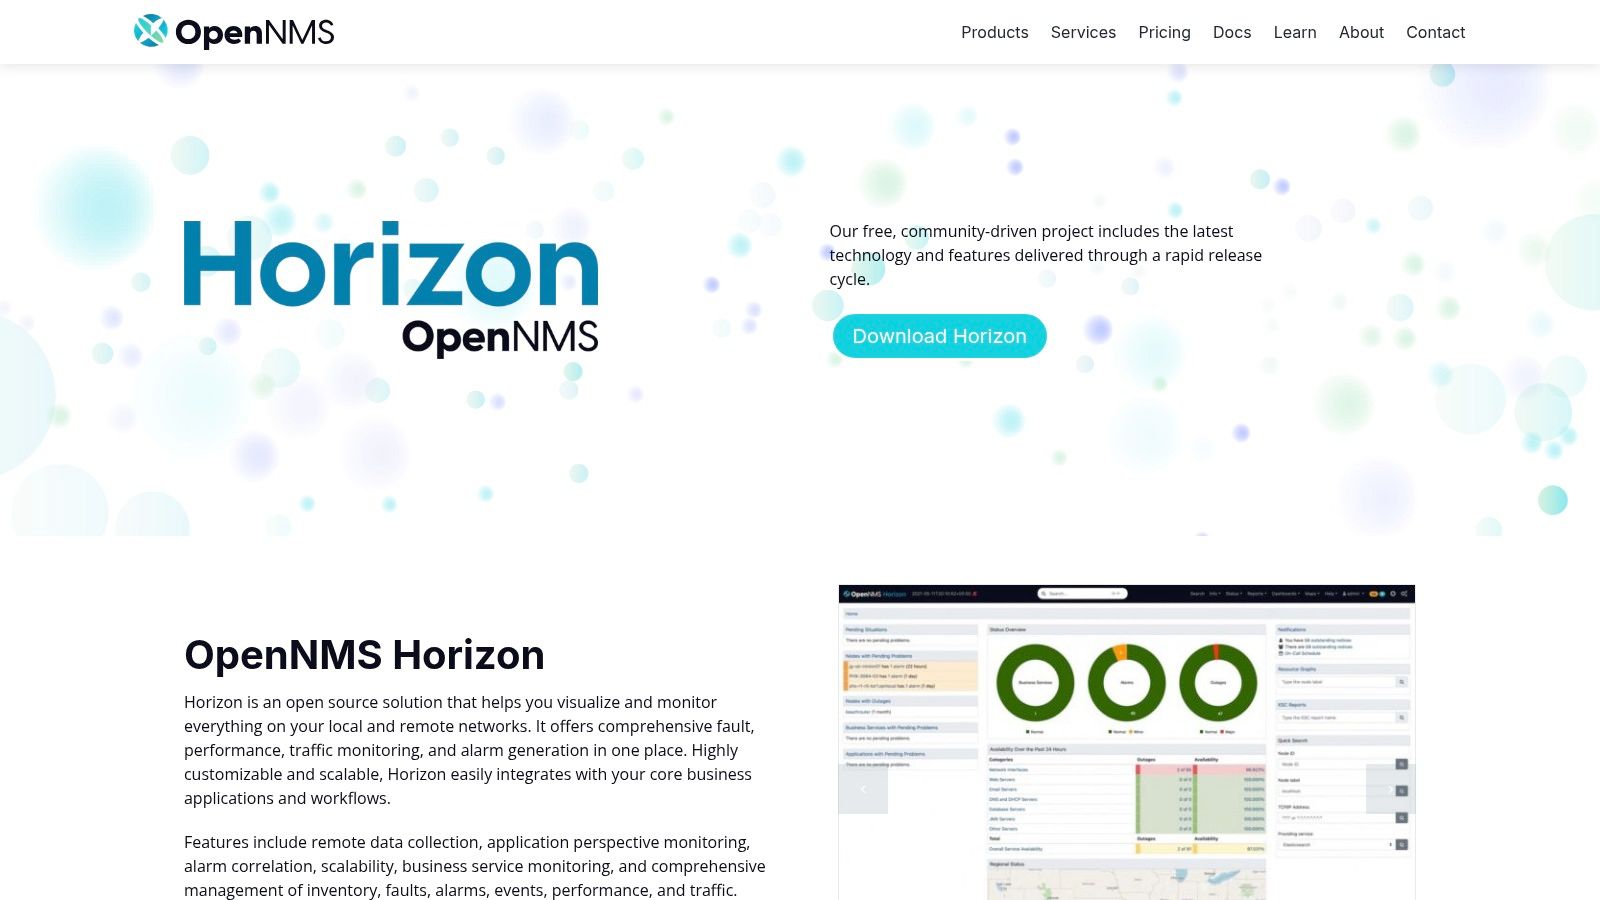
What makes OpenNMS Horizon one of the best free network monitoring tools is its focus on alarm correlation and topology awareness. It automatically discovers your network devices and intelligently groups related alarms, preventing the common "alert storm" that renders other tools useless. It also offers advanced features like flow analysis (NetFlow, sFlow) and remote data collection, giving you a complete picture of network performance and traffic patterns.
Finchum's Take on OpenNMS Horizon
OpenNMS is a monster of a tool, built for environments where scale is everything. It's Java-based, which means it has some serious horsepower but also demands more server resources than lighter-weight options. This isn't a tool you spin up on a whim; it’s a strategic platform for businesses that need to track service-level agreements (SLAs) and correlate events across a complex infrastructure.
Ideal Use Case: Best for medium to large organizations or managed service providers who need a powerful, centralized NMS to monitor distributed networks. Its service assurance capabilities are perfect for businesses needing to prove uptime for compliance or client contracts.
Implementation & Support: Deploying OpenNMS involves setting up a Linux server with its Java stack, a PostgreSQL database, and then letting it run its discovery processes. The initial configuration can be complex, and getting the service assurance and alarm correlation components dialed in requires a good bit of expertise. An improperly configured instance can be just as noisy as any other tool.
The team at Finchum Fixes IT has the experience to deploy and manage OpenNMS Horizon, ensuring it provides clear, actionable intelligence that protects your business from costly downtime.
Pros:
- Strong Enterprise Features: Includes service assurance, alarm correlation, and flow analysis at no license cost.
- Highly Scalable: Designed to monitor thousands of devices across multiple locations.
- Powerful Event & Alarm System: Intelligently reduces noise and helps pinpoint root causes.
Cons:
- Resource Heavy: The Java-based architecture requires more server memory and CPU than other tools.
- Complex to Deploy: Getting it installed and configured correctly is a significant undertaking.
Get It Here: https://www.opennms.com/horizon/
7. Checkmk Raw Edition
If you like the power of Nagios but dread the thought of manually configuring thousands of checks, Checkmk Raw Edition is your fast track to sanity. It bundles a high-performance monitoring core with a modern user interface and powerful automation, drastically cutting down the manual work. This is the perfect tool for an SMB that wants operational visibility today, not next quarter, by using a mix of agent-based and SNMP monitoring to quickly map the network.
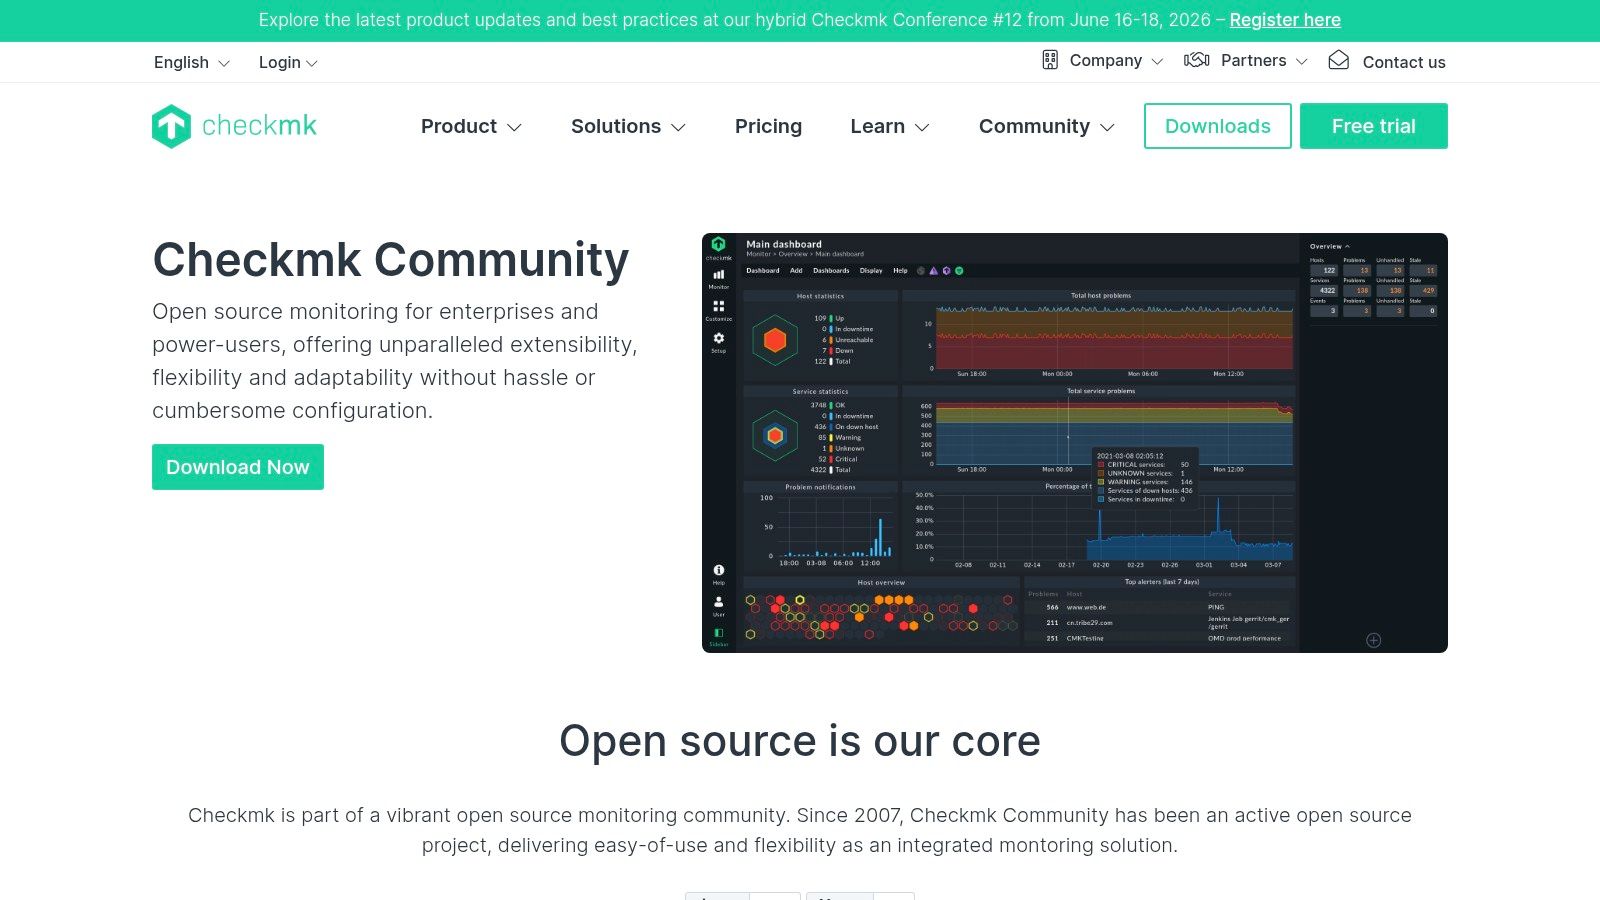
What makes it one of the best free network monitoring tools is its opinionated, workflow-driven approach. Instead of giving you a box of parts, Checkmk provides an integrated system with automatic service discovery and rule-based configuration. This means less time wrestling with config files and more time acting on real alerts. The free Raw Edition is fully-featured for most small to mid-sized environments.
Finchum's Take on Checkmk Raw Edition
Checkmk Raw is our go-to for businesses that need robust monitoring without the setup marathon of Zabbix. Its auto-discovery is impressively fast, and the pre-built checks cover about 90% of what a typical Johnson County business needs right out of the box.
Ideal Use Case: Great for teams that want a quick return on their time investment. It's an excellent fit for businesses needing fast, comprehensive visibility into common servers, network hardware, and applications without a dedicated monitoring specialist on staff.
Implementation & Support: Checkmk offers a pre-built virtual appliance, making the initial server setup much faster than building from scratch. Once running, you deploy agents or configure SNMP, and the system’s auto-inventory and rule-based configuration take over. The free Raw Edition uses the Nagios core, so while it’s powerful, certain enterprise-grade features are reserved for the paid tiers.
If you want to ensure your setup is optimized from the start, Finchum Fixes IT can get your Checkmk instance running and configured for your specific environment, helping you sidestep common configuration issues.
Pros:
- Fast Setup: Auto-discovery and pre-packaged checks provide value almost immediately.
- Integrated Solution: Combines the core, UI, and checks into one cohesive package.
- Strong Community: Built on a popular core with plenty of available documentation.
Cons:
- Freemium Model: Some high-availability and performance features are exclusive to paid editions.
- Nagios Core Limitations: The Raw edition is bound by some of the architectural limits of its Nagios foundation.
Get It Here: https://checkmk.com/product/checkmk-raw
8. PRTG 100 (Paessler PRTG)
If you run a Windows-heavy shop and need powerful monitoring without a steep learning curve, PRTG 100 is your go-to. Paessler offers its robust PRTG Network Monitor with a permanently free license for up to 100 "sensors." This isn't a stripped-down trial; it's the full-featured tool, perfect for small businesses in Johnson County that need to monitor core servers, switches, and critical services without getting bogged down in complex configurations. A single sensor might check the CPU load on a server, monitor bandwidth on a firewall, or ping a critical website.
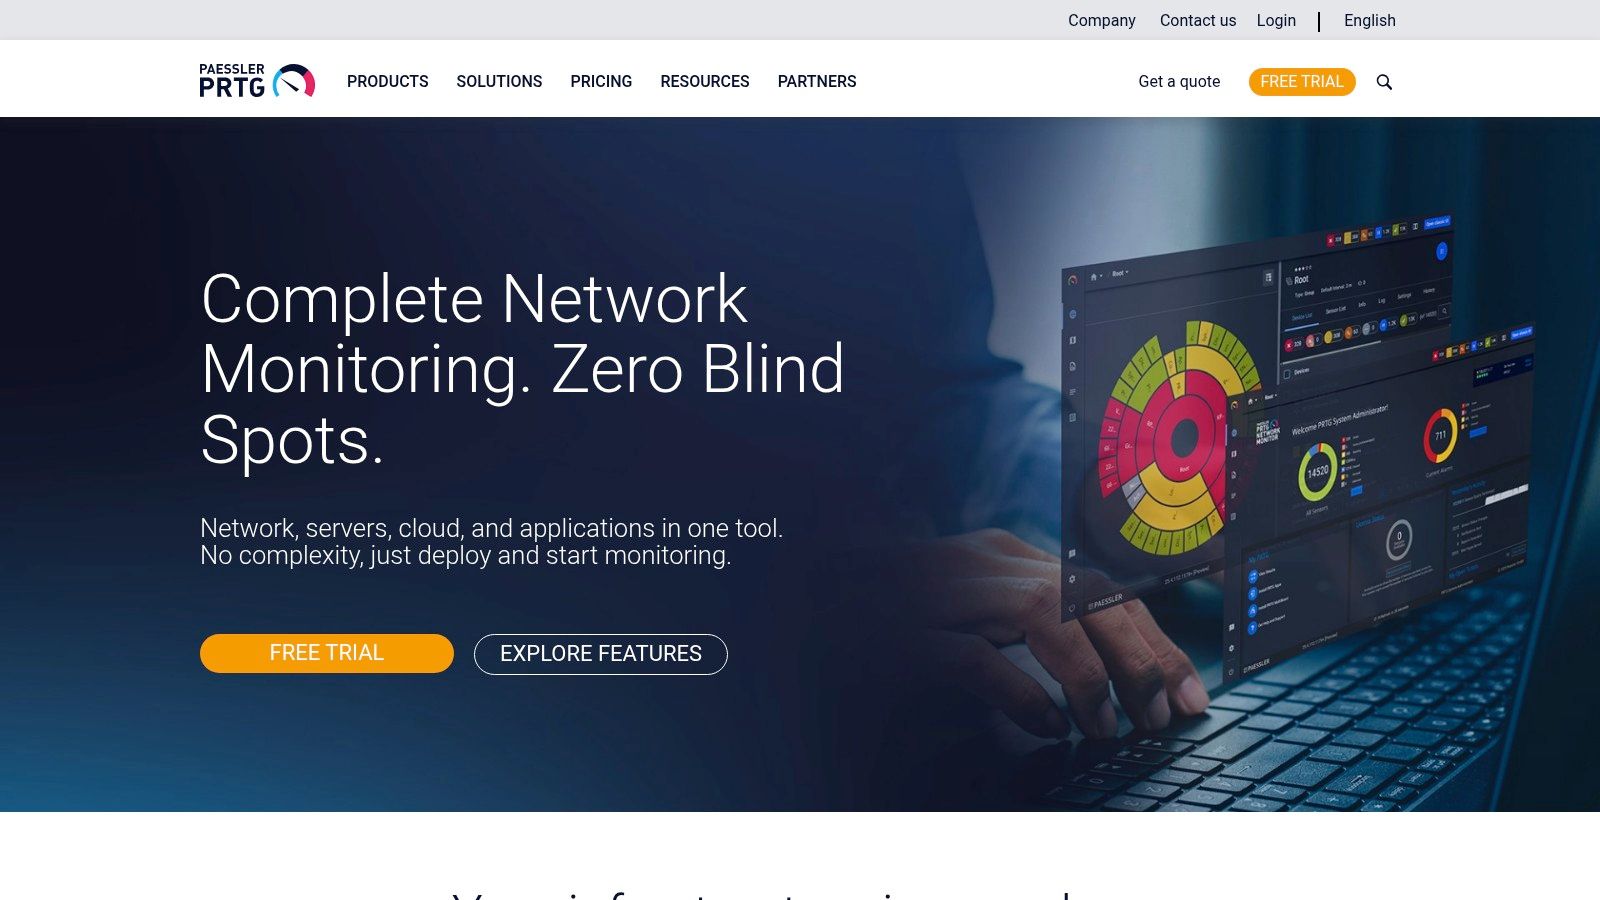
What makes it one of the best free network monitoring tools for many is its incredible speed-to-value. The setup wizard and auto-discovery features can map out your key devices and start collecting data in under an hour. It natively supports WMI for deep Windows monitoring, along with SNMP, flow protocols, and a huge library of pre-built sensors for everything from cloud services to specific hardware.
Finchum's Take on PRTG 100
PRTG is slick. Its UI is clean, and you can get meaningful data fast. The free 100-sensor limit is the main catch. You have to be strategic, focusing only on what truly matters to avoid hitting that ceiling. It's not a set-it-and-forget-it tool if you want to stay within the free tier.
Ideal Use Case: Small businesses or specific departments needing to monitor a handful of critical assets. It excels at watching over on-prem Windows servers, key network switches, and ensuring uptime for essential services like DNS and HTTP without requiring a Linux guru to set it up.
Implementation & Support: Installation is a breeze on a Windows server. The guided setup helps you add devices and apply sensors quickly. The challenge is managing your sensor count. We often help clients prioritize, using one sensor to ping multiple devices instead of one each, or focusing only on mission-critical metrics to stay under the 100-sensor limit and avoid surprise costs.
The team at Finchum Fixes IT can help you deploy PRTG 100 strategically, ensuring you get maximum visibility without outgrowing the free license prematurely.
Pros:
- Fast Setup: Go from download to monitoring in minutes with its polished UI and wizards.
- Broad Sensor Library: Excellent out-of-the-box support for common devices and services, reducing custom work.
- Windows-Friendly: Deep integration with Windows environments via WMI is a major plus.
Cons:
- 100-Sensor Limit: Requires careful planning and can be outgrown quickly.
- Windows-Centric: The core server software runs best on Windows, which might not suit all environments.
Get It Here: https://www.paessler.com/
9. Netdata
If you need to know what’s happening on a server right now, Netdata is your tool. It provides incredible real-time, per-second visibility into system performance with almost zero configuration. It’s not for mapping out your entire network of switches and routers, but for understanding the immediate health of a critical server, gateway, or even a problematic Wi-Fi access point, it’s unparalleled. Think of it as an instant EKG for your machine’s network interfaces, bandwidth, and socket activity.

What makes it one of the best free network monitoring tools for troubleshooting is its speed and simplicity. The low-overhead agent installs in minutes and immediately generates interactive, live dashboards with over 800 integrations. You can spot a sudden bandwidth spike or a burst of packet errors the second it happens, which is a lifesaver for diagnosing intermittent issues that other tools miss.
Finchum's Take on Netdata
Netdata is the best 'instant gratification' monitoring tool out there. We use it for quick diagnostics on client servers in the Indianapolis area when we suspect a resource hog is causing trouble. It's not a full-blown Network Management System, but for live troubleshooting, it's brilliant.
Ideal Use Case: Perfect for developers, sysadmins, and IT teams who need to quickly diagnose performance bottlenecks on individual servers, VMs, or containers. It’s also great for monitoring edge devices and gateways where low resource usage is critical.
Implementation & Support: Installation is as simple as running a single script on a Linux or macOS machine. It auto-detects everything and starts working instantly. For centralized viewing, you can connect multiple agents to the free Netdata Cloud.
Pros:
- Easiest Setup: Provides instant, meaningful data with minimal configuration.
- Real-Time Visibility: Per-second metrics are perfect for troubleshooting live issues.
- Extremely Lightweight: The agent has a very low impact on system resources.
Cons:
- Not a Full NMS: Lacks broad SNMP device inventory and network-wide mapping.
- Limited Long-Term Storage: Best for immediate analysis; long-term data retention requires external solutions.
Get It Here: https://www.netdata.cloud/
10. ntopng Community
When your network slows to a crawl and you need to know exactly who or what is hogging all the bandwidth, ntopng Community is the forensic tool you pull out. It's less of an all-in-one network health monitor and more of a high-powered traffic microscope. By analyzing network flows and packets, it gives you a granular, real-time view of every conversation happening on your network, making it a perfect complement to a broader monitoring system like Zabbix or Checkmk.
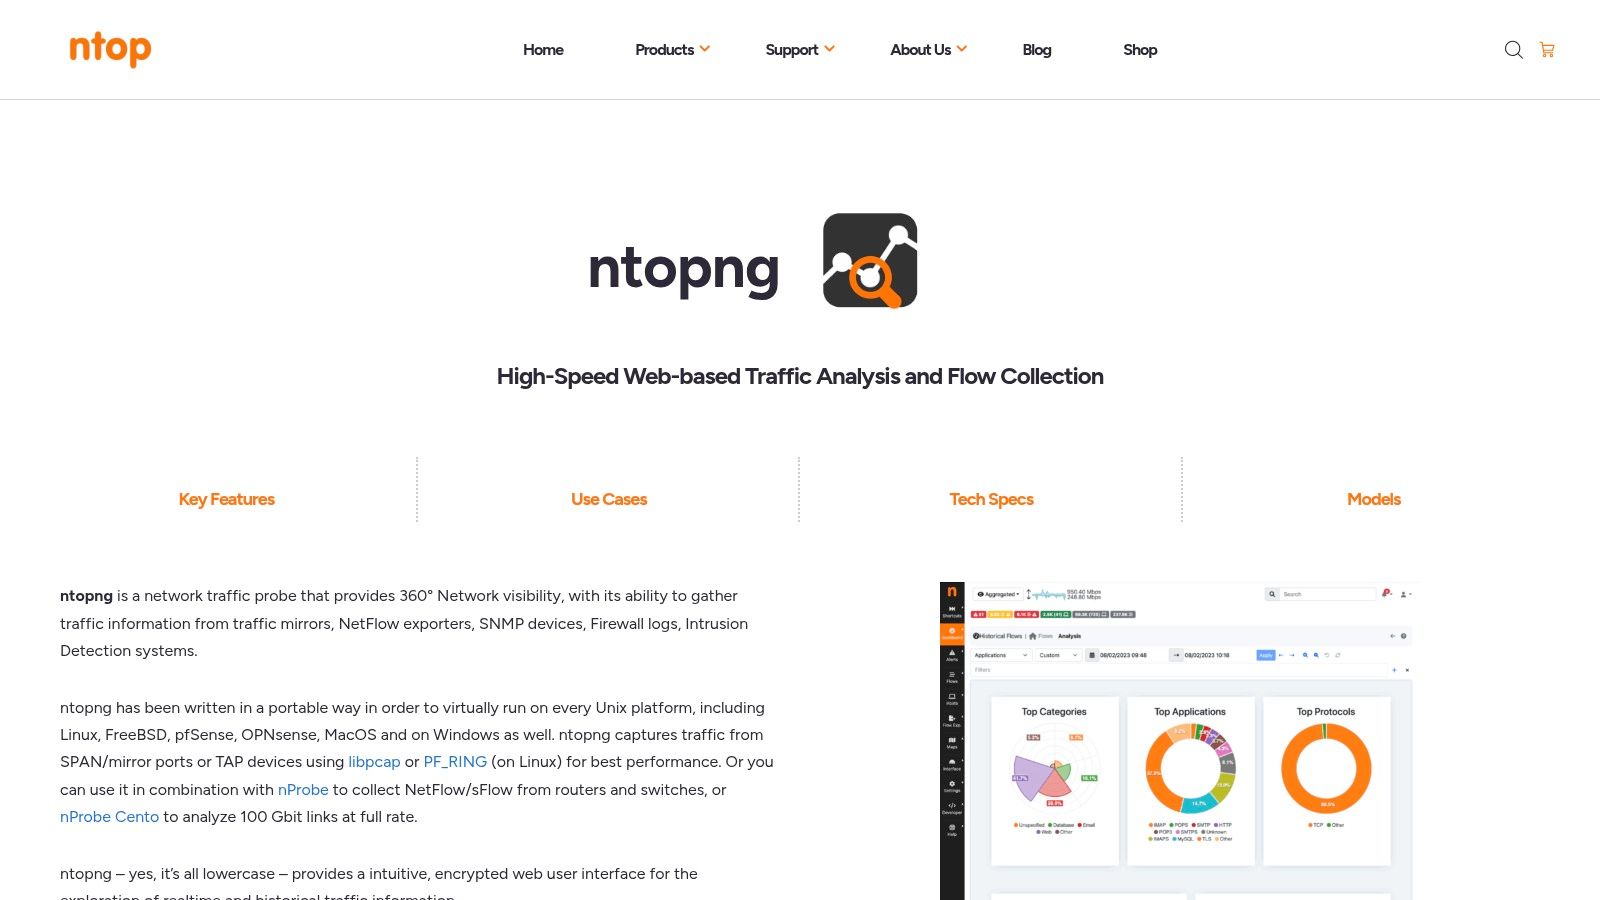
What makes it one of the best free network monitoring tools is its focus on deep traffic visibility. It quickly identifies top talkers, reveals Layer 7 application protocols (like BitTorrent or Netflix), and charts traffic patterns over time. For any Johnson County business trying to troubleshoot mysterious slowdowns or investigate unusual data spikes, ntopng provides the evidence needed to pinpoint the source.
Finchum's Take on ntopng Community
Think of ntopng as your network detective. It won't tell you if a server's CPU is overheating, but it will tell you if that server is suddenly sending huge amounts of data to an unknown IP in China. It's an indispensable tool for security and performance forensics.
Ideal Use Case: Excellent for businesses that need to perform deep-dive traffic analysis to troubleshoot bandwidth issues, identify non-business application usage, or investigate potential security incidents. It's the right tool for answering the question, "Where is all my bandwidth going?"
Implementation & Support: ntopng is designed to work with a SPAN/mirror port on a switch or an inline network tap. Setting this up requires a solid understanding of network architecture. You’ll need a dedicated machine (typically Linux) to run the software and capture the traffic feed. While the web interface is intuitive, configuring the data source correctly is the critical first step.
The Finchum Fixes IT team can integrate ntopng into your existing network, ensuring it's configured to capture the right traffic without impacting performance. We make sure you get clear, actionable data for your toughest network mysteries.
Pros:
- Deep Traffic Insight: Provides granular, flow-level detail that other tools miss.
- Intuitive UI: The web-based interface makes it easy to drill down into hosts, protocols, and conversations.
- Great for Forensics: Perfect for post-incident analysis or real-time troubleshooting.
Cons:
- Not a Full NMS: It's focused on traffic analysis, not device health, up/down status, or alerting.
- Paid Features: Some advanced analytics and historical data retention are reserved for paid versions.
Get It Here: https://www.ntop.org/ntopng/
11. Cacti
When your main goal is seeing long-term performance trends and planning for future capacity, Cacti is an old-school champion that still delivers. It’s a free, open-source tool dedicated to one thing: turning time-series data, primarily from SNMP, into beautiful, easy-to-read graphs. For any business on the I-65 corridor that needs to know exactly when to upgrade a switch or internet circuit based on historical utilization, Cacti is the answer.
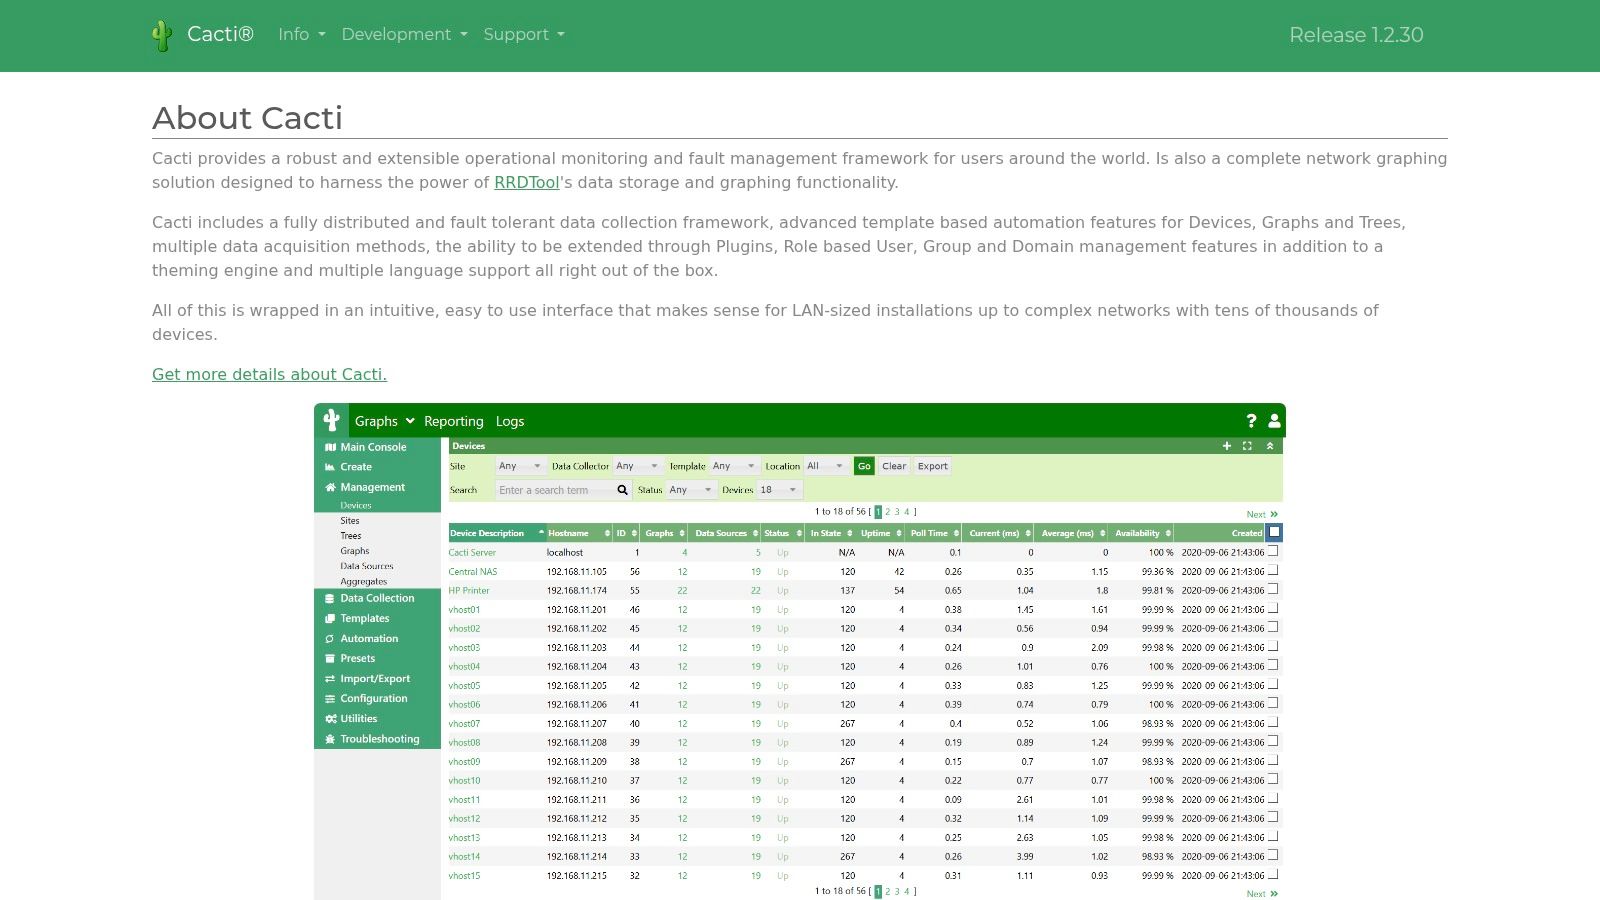
Its core strength lies in its tight integration with RRDTool, a high-performance data logging and graphing system. Cacti makes this powerful engine accessible, with features like automated device discovery and graph templates. This makes it one of the best free network monitoring tools for visualizing bandwidth, CPU load, and memory usage over months or even years.
Finchum's Take on Cacti
Cacti is the gold standard for historical graphing. It's lightweight, fast, and does its job extremely well. We often use it alongside more complex alert-focused systems to give Johnson County businesses a clear view of their network's long-term health and growth.
Ideal Use Case: Excellent for network administrators and engineers who need detailed historical performance graphs for capacity planning, trend analysis, and troubleshooting intermittent issues. It’s perfect for monitoring switch ports, router interfaces, and server resources at scale.
Implementation & Support: Cacti runs on a standard LAMP (Linux, Apache, MySQL, PHP) stack, making deployment straightforward for anyone with basic web server experience. The main work involves discovering devices via SNMP and applying the correct graph templates. While its core function is graphing, a plugin architecture allows for expanded features, though it's not an all-in-one alerting suite out of the box.
Pros:
- Superior Graphing: Unmatched for creating detailed, long-term historical performance graphs.
- Lightweight: Runs efficiently and doesn't require massive server resources.
- Great for Capacity Planning: Provides the data needed to justify hardware and bandwidth upgrades.
Cons:
- Dated UI: The interface and workflows can feel clunky compared to modern platforms.
- Limited Alerting: Its alerting capabilities are not as robust as tools like Zabbix or Nagios.
Get It Here: https://www.cacti.net/
12. SmokePing
If you've ever battled with an ISP over flaky service, SmokePing is the tool that brings the receipts. It’s not an all-in-one network management system; instead, it does one thing exceptionally well: visualizing network latency and packet loss over long periods. This free, open-source tool is perfect for proving that the internet connection at your Franklin office really is dropping packets every afternoon, giving you concrete data for support tickets.
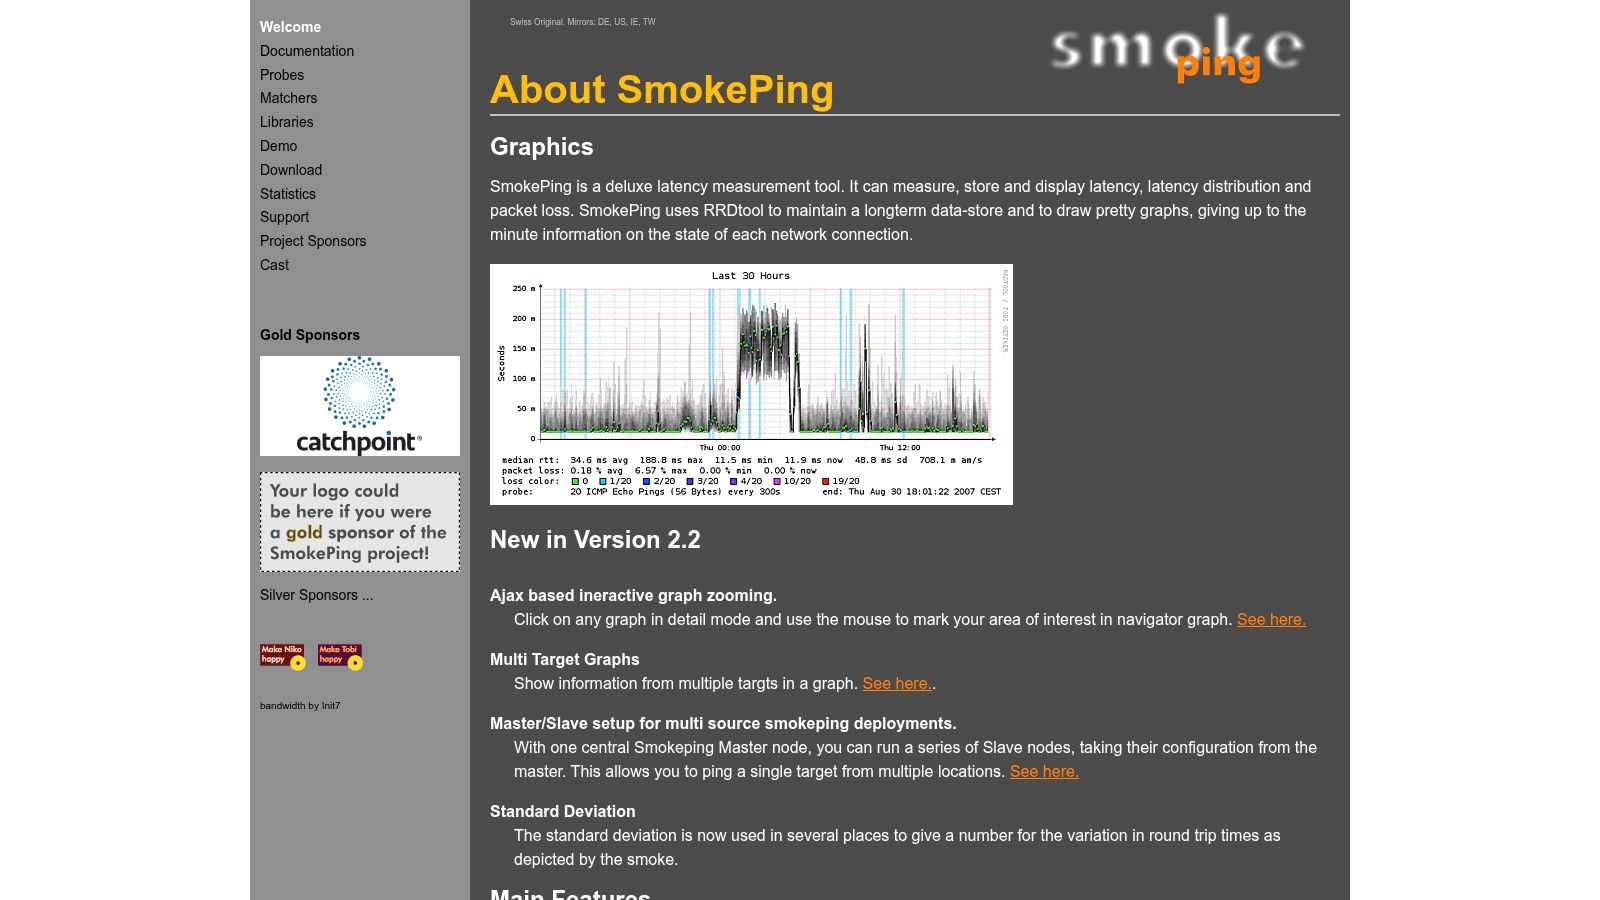
What makes SmokePing one of the best free network monitoring tools is its focus and clarity. It uses RRDtool to generate graphs that show not just the average latency, but the variance in latency-the "smoke" on the graph-which is often the first sign of a congested or failing link. You can set it up to monitor critical paths like your VoIP gateway, WAN links between offices, or your primary ISP connection.
Finchum's Take on SmokePing
SmokePing is old-school, but it's still the king for historical latency analysis. Its graphs are the industry standard for diagnosing intermittent network problems. Its sole purpose is to track latency and loss, so you'll run it alongside a broader NMS, not as a replacement for one.
Ideal Use Case: Essential for any business that relies on stable, low-latency connections, especially those using VoIP, video conferencing, or with offices connected via WAN links. It's the perfect tool for holding ISPs and service providers accountable.
Implementation & Support: SmokePing is a lightweight Perl application that runs on a Linux server. Installation is straightforward for anyone comfortable with the command line. The configuration is done through a text file, where you define the hierarchy of targets you want to probe. While simple, it requires some basic Linux admin skills to get running.
The team at Finchum Fixes IT often deploys SmokePing as part of a larger monitoring stack for Johnson County businesses to keep a close eye on ISP performance and ensure network stability.
Pros:
- Best-in-Class Visualizations: The "smoke" graphs are unmatched for spotting jitter and intermittent packet loss.
- Lightweight & Reliable: It’s simple, stable, and uses very few system resources.
- Highly Focused: Does one job perfectly without unnecessary complexity.
Cons:
- Limited Scope: Only monitors latency and loss, not device health, CPU, or memory.
- Outdated Interface: The web interface is functional but very basic by modern standards.
Get It Here: https://oss.oetiker.ch/smokeping/
Top 12 Free Network Monitoring Tools — Feature Comparison
| Tool | Core Focus ✨ | UX & Quality ★ | Standout Strength 🏆 | Target Audience 👥 | Price / Value 💰 |
|---|---|---|---|---|---|
| Zabbix | ✨ Full‑stack discovery (SNMP/agent/IPMI/cloud) | ★★★★ (powerful; learning curve) | 🏆 Scales with no license limits | 👥 SMB → Enterprise NOC teams | 💰 Free OSS, no license caps |
| Nagios Core | ✨ Plugin‑driven host/service checks (ICMP/TCP/SNMP) | ★★★ (lean core; manual config) | 🏆 Massive plugin ecosystem | 👥 Advanced admins & scripting teams | 💰 Free OSS |
| Icinga | ✨ Distributed monitoring, REST API, modern UI | ★★★★ (better UX than Nagios) | 🏆 Modern UI + DevOps integrations | 👥 Hybrid Windows/Linux & DevOps | 💰 Free OSS |
| Prometheus + Blackbox | ✨ Time‑series metrics + endpoint probes (ICMP/HTTP/TCP) | ★★★★ (powerful; pairs with Grafana) | 🏆 Cloud‑native metrics & PromQL | 👥 SREs & cloud‑native teams | 💰 Free OSS |
| LibreNMS | ✨ SNMP‑first auto‑discovery, device & wireless metrics | ★★★★ (fast multi‑vendor setup) | 🏆 Quick path to multi‑vendor visibility | 👥 Network engineers, multi‑vendor shops | 💰 Free OSS |
| OpenNMS Horizon | ✨ Availability, performance, flow & service views | ★★★ (feature‑rich but heavier) | 🏆 Deep enterprise NMS capabilities | 👥 Large networks & enterprise IT | 💰 Free OSS |
| Checkmk Raw Edition | ✨ Agent/SNMP auto‑inventory, dashboards & rules | ★★★★ (fast operational value) | 🏆 Opinionated workflows for daily ops | 👥 SMBs seeking quick ops wins | 💰 Free Raw; enterprise paid |
| PRTG 100 (Paessler) | ✨ Sensor‑based SNMP/WMI/flow/HTTP monitoring | ★★★★★ (polished UI & wizards) | 🏆 Very quick time‑to‑value | 👥 Windows‑centric SMBs | 💰 Free 100 sensors; paid tiers |
| Netdata | ✨ Per‑second telemetry, 800+ integrations, low overhead | ★★★★★ (instant, interactive) | 🏆 Real‑time troubleshooting at the edge | 👥 Edge servers, ops troubleshooting | 💰 Free OSS; optional Cloud |
| ntopng Community | ✨ Flow & packet‑level traffic analytics (L7) | ★★★★ (intuitive traffic drilldowns) | 🏆 Deep bandwidth forensics & flows | 👥 Bandwidth analysts & security teams | 💰 Free community; paid pro |
| Cacti | ✨ SNMP/RRDTool graphing for utilization & trends | ★★★ (lightweight but old UI) | 🏆 Long‑term capacity & trend graphs | 👥 Capacity planners & NOC teams | 💰 Free OSS |
| SmokePing | ✨ RTT & packet‑loss graphs with hierarchical probes | ★★★★ (simple, reliable) | 🏆 Best‑in‑class historical latency visuals | 👥 WAN/ISP/VoIP validation teams | 💰 Free OSS |
Take the Guesswork Out of Your Network Performance
Well, there you have it. We've just sprinted through a dozen of the best free network monitoring tools available today. From the all-encompassing power of Zabbix to the laser-focused latency checks of SmokePing, the open-source community has gifted us an incredible arsenal for keeping our networks humming.
You've seen tools that are perfect for a small Greenwood office with a handful of devices, like PRTG 100, and others like Nagios Core or Icinga that can scale to monitor complex infrastructure spanning the I-65 corridor. The key takeaway is that you absolutely do not need to fly blind. Network slowdowns, spotty Wi-Fi in that old brick building downtown, and mysterious connection drops are not just a cost of doing business; they are solvable problems.
Turning Data into Dollars
The real challenge isn't installing these tools. It's configuring them to provide meaningful business intelligence. An unconfigured monitor is just a noise machine, flooding your inbox with thousands of alerts that don't tell you if you're about to have a server failure or if someone just rebooted their PC.
This is where the rubber meets the road. Proper configuration converts that raw data into actionable insights that directly impact your bottom line.
- Preventing Downtime: A correctly tuned alert for rising disk latency can predict a RAID array failure weeks in advance, letting you schedule a repair instead of suffering a catastrophic crash. That’s the difference between a planned maintenance window and a $9,000-per-minute outage.
- Optimizing Resources: Are you paying for 1-gigabit internet but only seeing 300 Mbps speeds? Tools like ntopng can pinpoint the exact device or application hogging your bandwidth, turning that "wasted tech time" into a quick fix and restoring the performance you paid for.
- Meeting Compliance: For businesses handling sensitive data, whether it's HIPAA in healthcare or CMMC for government contracts, network monitoring is non-negotiable. We can configure these tools to log traffic, track access, and generate reports that align directly with NIST CSF controls, providing concrete evidence of your security posture.
Choosing Your Champion: A Quick Guide
Feeling a bit of analysis paralysis? Let’s break it down. Your choice should be driven by three factors: your technical comfort level, your environment's scale, and your specific goals.
- For the DIY-Minded SMB: If you have some IT chops and a straightforward network, start with LibreNMS or PRTG 100. Their auto-discovery features and user-friendly interfaces offer the fastest path to getting valuable data without a steep learning curve.
- For the Growing Tech Company: If your Hamilton County business is expanding and you need deep customization, look at Zabbix or Prometheus. They require more setup but provide unmatched flexibility for monitoring custom applications, cloud services, and complex server stacks.
- For the "Just Tell Me It's Working" Crowd: If you're a business owner who would rather focus on your customers than on network configs, your best tool is the phone. That’s where a managed service approach comes in. We handle the monitoring, interpret the data, and fix issues before they become business-disrupting problems.
In our 17 years serving Central Indiana, we've seen it all, from misconfigured UniFi networks causing chaos in Johnson County warehouses to aging server hardware grinding productivity to a halt. The right monitoring tool, in the right hands, is the first step to building a stable, predictable, and high-performance IT foundation. You get a network that just works, and a budget that doesn't have any nasty surprises.
Ready to stop guessing and start knowing what's happening on your network? Let Finchum Fixes IT take the complexity off your plate. We'll conduct a Free Network Assessment for your Greenwood or Indianapolis area business to identify bottlenecks and show you how a managed monitoring strategy can save you time and money. Schedule your no-obligation audit today and get the peace of mind that comes with expert oversight.