Top Network Monitoring Tools for Indiana Businesses
Your network is slow. Staff in a Fountain Square office lose the Wi-Fi signal every time a conference room fills up. A Greenwood business park still runs an aging server that sounds fine until payroll stalls, cloud apps hang, and nobody can print. That kind of slowdown feels like an annoyance. It's usually an early warning.
Downtime hits payroll, phones, card processing, EMR access, dispatch systems, and remote VPN sessions. For some businesses, downtime can cost up to $9,000 per minute. Even when it doesn't become a full outage, wasted tech time drags down billable hours and turns the monthly budget into guesswork. A sluggish network usually means deeper issues like saturated links, bad switch ports, weak Wi-Fi design, noisy firewall rules, or blind spots in encrypted traffic.
We've seen this all along the I-65 corridor. In our 17 years of local service, we've walked into old brick buildings with spotty Wi-Fi, server closets with no airflow, and “temporary” switches that somehow became permanent. The fix isn't guessing. The fix is monitoring the right things, setting the right thresholds, and tying alerts to actual remediation so business continuity stays intact.
TL;DR
- Slow networks cost money: Slowness is often the first sign of outages, security issues, or failing hardware.
- This list covers 10 practical options: Commercial and open-source network monitoring tools, plus a managed service route for Indiana SMBs.
- Business continuity comes first: The right platform helps prevent downtime and supports compliance work tied to HIPAA, CMMC, and NIST CSF.
- Trade-offs matter: Some tools are easier to deploy, others give deeper control, and some create more admin work than they save.
- Managed monitoring fits many SMBs best: If your team doesn't want another dashboard, outsourcing monitoring and remediation can be the better ROI play.
1. Auvik
Auvik is the one I bring up when a Johnson County business has multiple sites, a lean internal IT team, and zero appetite for babysitting another on-prem server. It's cloud-hosted, fast to deploy, and built around visibility first. If you've inherited a network with mystery switches, unlabeled uplinks, and old UniFi networking gear mixed with other vendors, Auvik cleans that up quickly.
Its strength is the combination of automated discovery, real-time L2 and L3 topology mapping, SNMP and WMI monitoring, syslog collection, configuration backup, and flow analysis through TrafficInsights. That matters when your continuity plan depends on finding the actual choke point instead of blaming the ISP every time Microsoft 365 feels slow.
Where Auvik works best
Auvik fits branch offices and multi-site shops well. One dashboard, lightweight collectors, and role-based access make it easier to support a Greenwood office, a warehouse off the interstate, and a small satellite location in Hamilton County without building a mini NOC.
What I like in practice:
- Fast setup: You can get useful visibility without a long rollout.
- Good map quality: The topology view helps non-network people understand what's connected to what.
- Useful traffic insight: NetFlow, IPFIX, sFlow, and J-Flow support help identify top talkers and ugly surprises.
What to watch:
- Quote-based pricing: You'll need a real conversation to know what the monthly number looks like.
- Add-on costs: TrafficInsights isn't always included.
- Firewall changes: Collectors need outbound connectivity, which can trip up stricter environments.
Practical rule: If your team won't maintain an on-prem monitoring stack, SaaS monitoring usually beats “we'll get to it later.”
Auvik's official product page is Auvik network management. For local deployment strategy, this guide on network monitoring best practices for Indiana businesses pairs well with it.
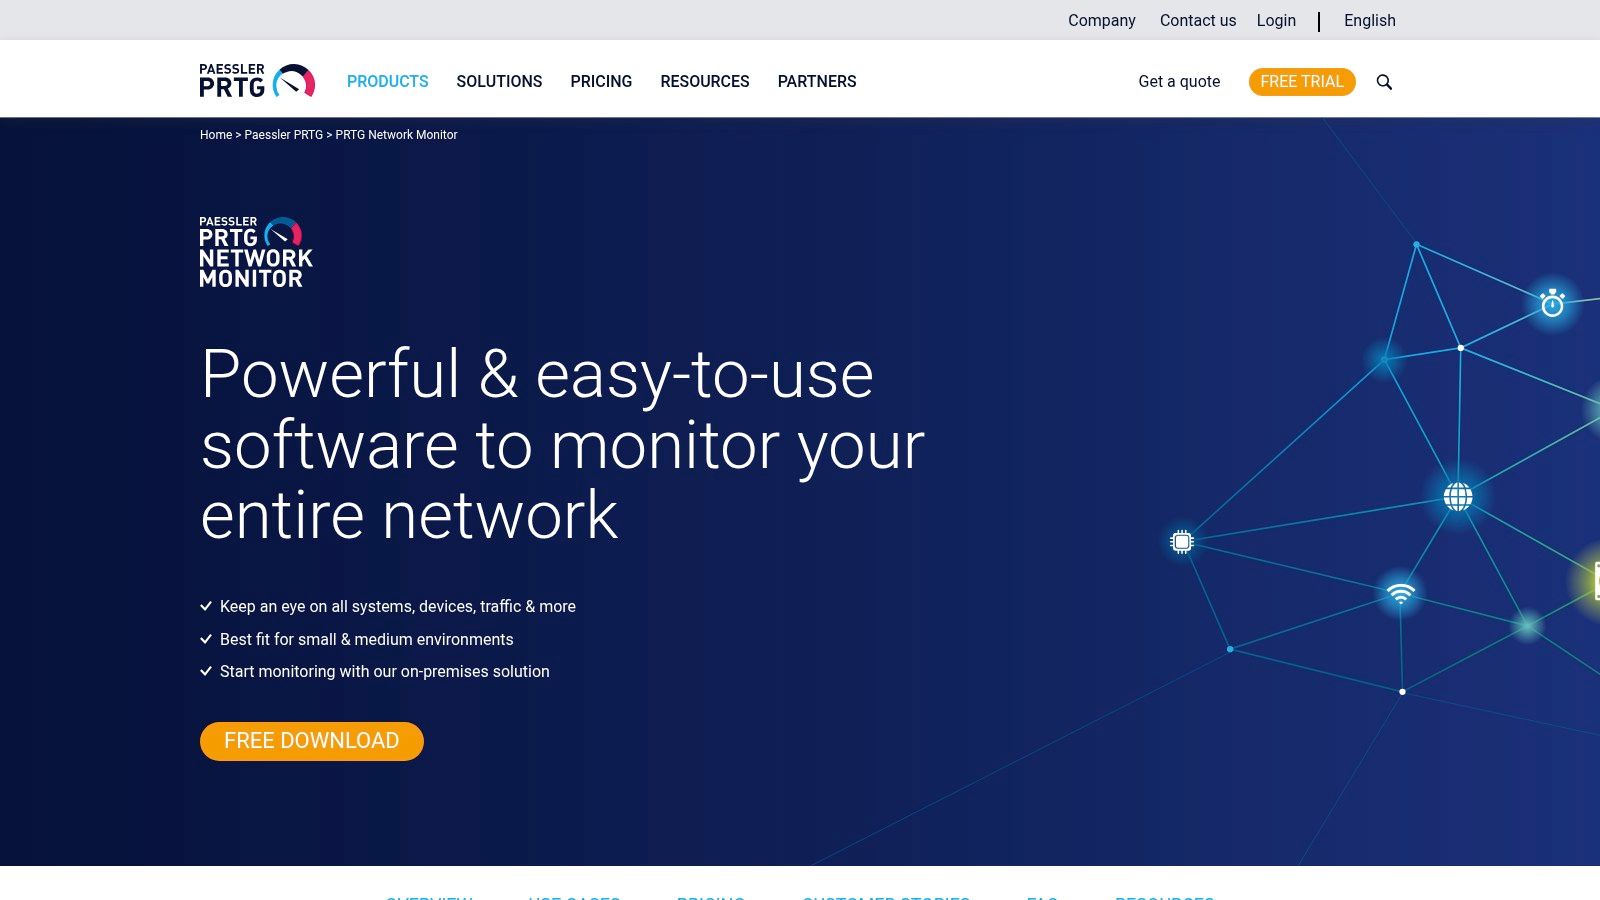
2. Paessler PRTG Network Monitor

PRTG has been around long enough to earn trust, and it still makes sense for a lot of SMB environments. If you want one tool that can watch network devices, servers, applications, and remote sites from your own environment, PRTG is still a solid pick. It's especially good for businesses that want on-prem control instead of handing everything to a SaaS platform.
The sensor model is both its strength and its trap. You can monitor with SNMP, WMI, NetFlow, sFlow, IPFIX, packet sniffing, and API-based checks. You also get custom dashboards, maps, reports, remote probes, and broad sensor coverage. But if nobody plans sensor usage well, licensing gets messy fast.
Why admins still like PRTG
PRTG works well in a mixed environment where one person wears three hats. A small healthcare office trying to stay aligned with HIPAA expectations, or a machine shop serving defense work and thinking about CMMC, often wants deep visibility without building a giant platform from scratch.
A few practical truths:
- Transparent tiers: Published pricing makes budget planning easier than quote-only vendors.
- Remote probes help: Good fit for distributed offices across downtown Indy tech hubs and suburban branches.
- Customization takes time: The bigger the environment, the more tuning you'll do.
Business continuity planning depends on knowing how long systems can be down and how much data loss is acceptable. Recovery Time Objectives and Recovery Point Objectives are the backbone of that planning, as LogicMonitor explains in its overview of RTO and RPO in business continuity planning. PRTG gives you the telemetry. You still need to tie alerts to those business targets.
PRTG's official site is Paessler PRTG Network Monitor. If you're trying to tie sensors back to user complaints, this local post on optimizing network performance for SMBs is worth reading.
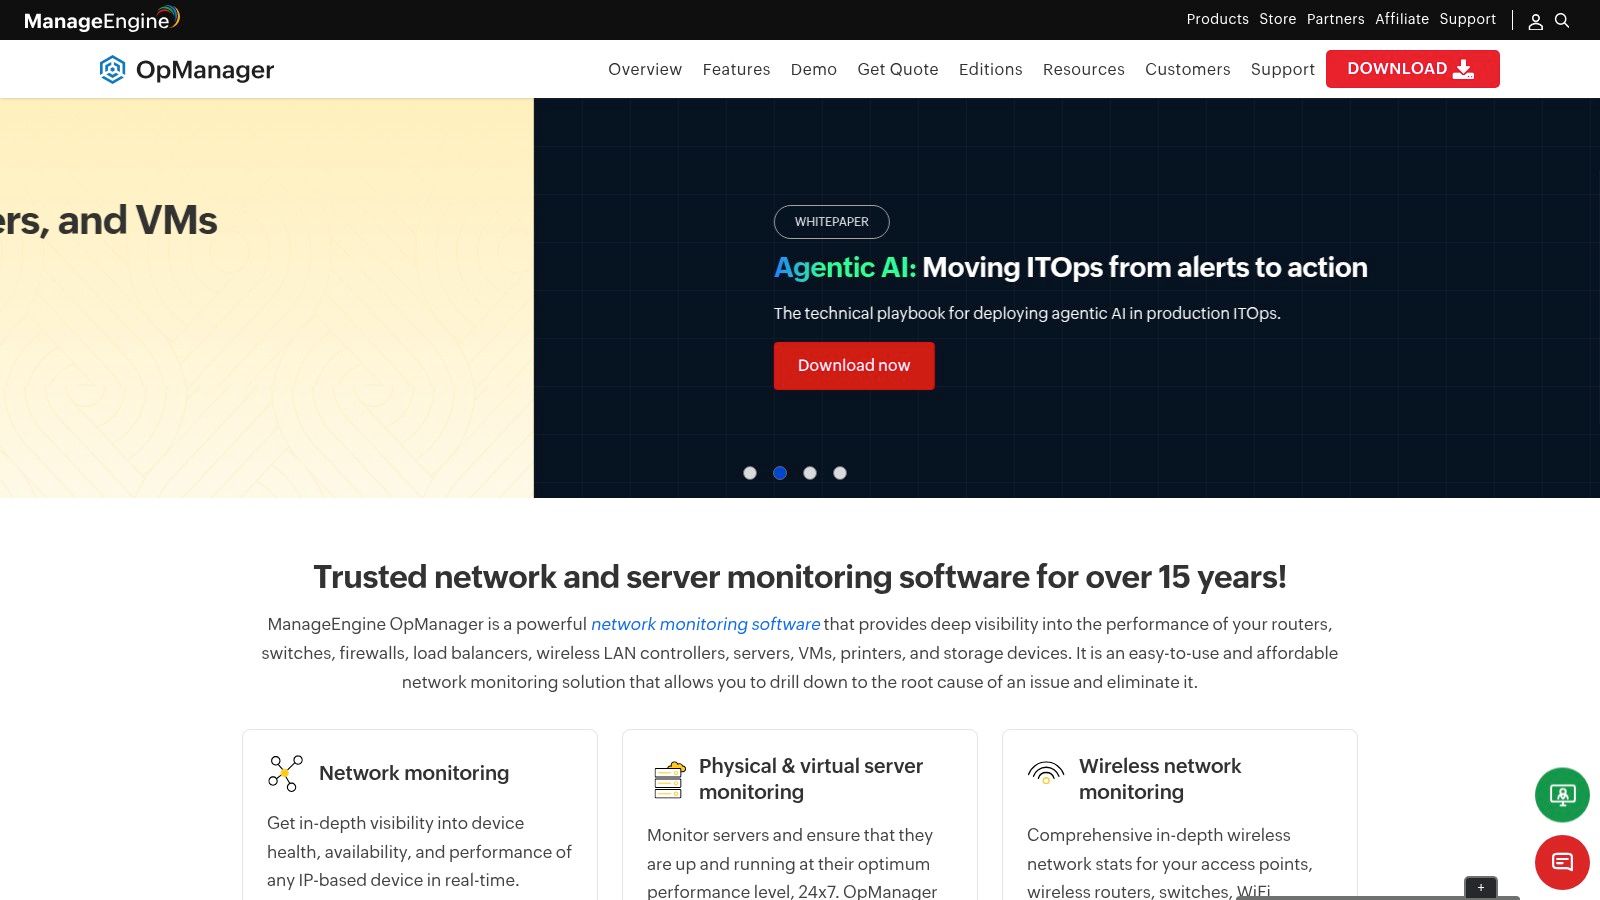
3. ManageEngine OpManager
OpManager makes sense when you already live in the ManageEngine world or you want broad monitoring from a product that feels familiar to Windows-heavy teams. I see it land well in offices where the network, servers, and help desk all need to talk to each other, but nobody wants to stitch together five unrelated products.
It covers SNMP, WMI, and CLI monitoring, automatic discovery, alarms, reports, dashboards, and topology maps. The core product is capable. The catch is that deeper flow visibility often means adding more modules, and that's where people start to lose the plot.
The trade-off with OpManager
For a growing Indianapolis-area business, OpManager can be a practical middle ground. It handles device monitoring, fault management, and scale-up options better than many cheap tools. If the environment is full of Windows servers, virtualization, and standard switching, the learning curve is manageable.
The downside is edition complexity.
- Broad base feature set: Good out of the box for common SMB needs.
- Add-ons add up: NetFlow and deeper analytics may push you into a bigger stack.
- Heavier at scale: Larger deployments need stronger server resources and more care.
I've seen this play out in old office parks south of Indy where one network issue was really three problems. A bad switch uplink, noisy broadcast traffic, and poor AP placement. OpManager can surface all of that, but only if someone configures the discovery rules and thresholds correctly.
The vendor site is ManageEngine OpManager. If your team is still reacting one outage at a time, this article on network troubleshooting steps for Indiana SMBs is the right companion read.
4. SolarWinds Network Performance Monitor
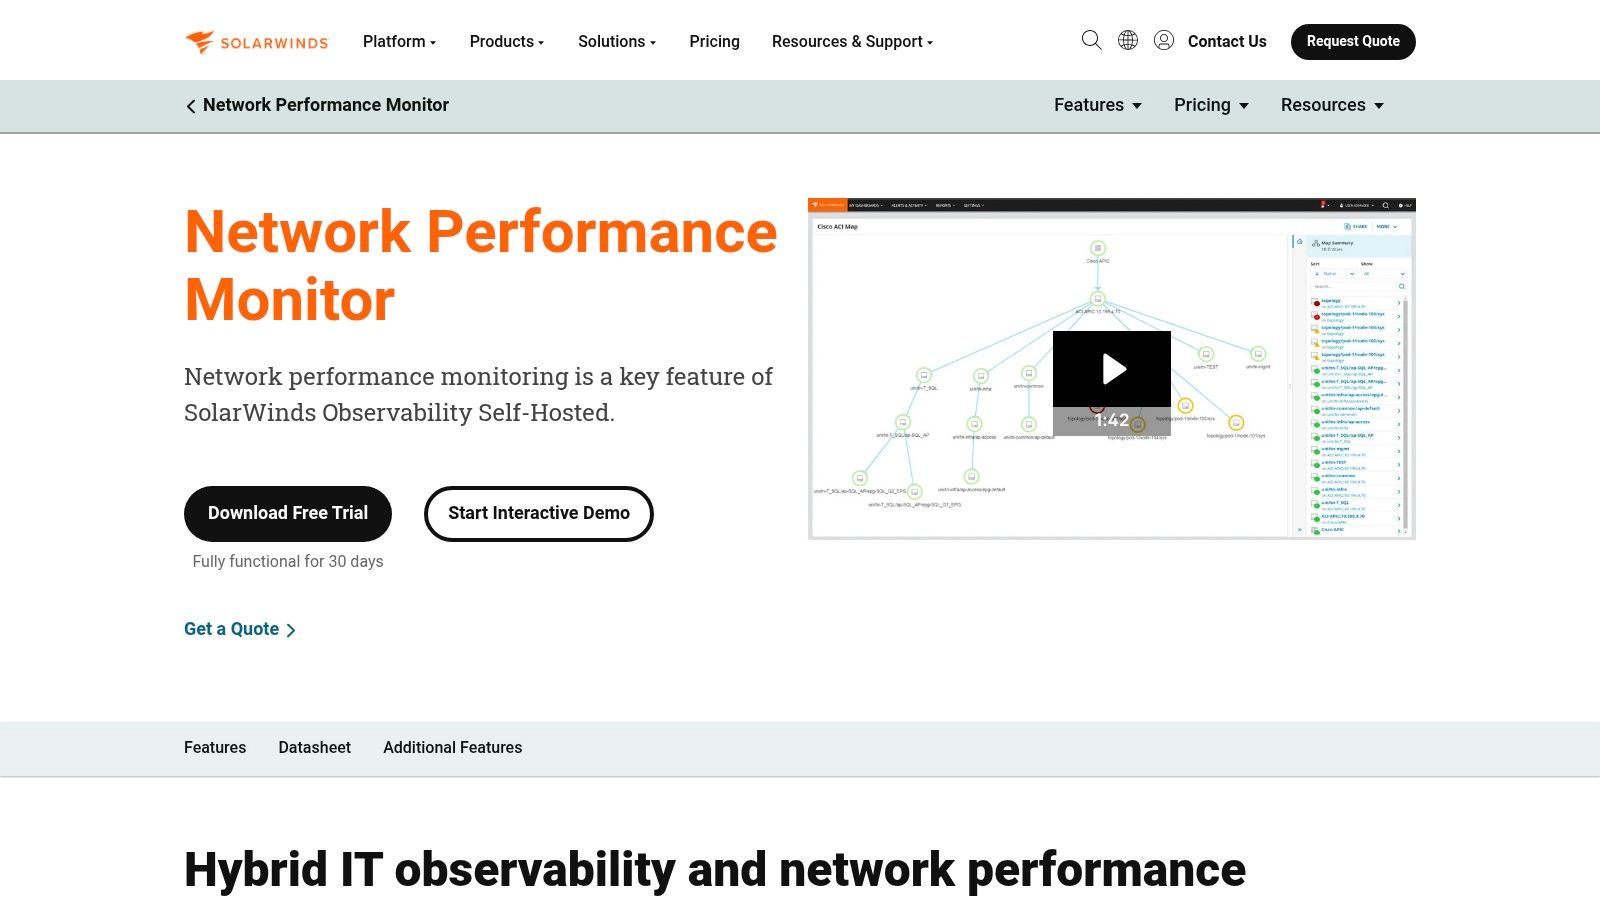
SolarWinds NPM is for teams that want depth. Not just “is the switch up,” but interface trends, path analysis, alerting logic, maps, reporting, and a broader ecosystem through the Orion platform. For larger SMBs and lower-midmarket environments, that depth can be worth the overhead.
I usually recommend SolarWinds when the network is important enough that “pretty good” visibility isn't enough. Think multi-building campuses, heavier server loads, more VLAN segmentation, and stricter compliance pressure under NIST CSF or HIPAA. It's a mature product, and it acts like one.
What it gets right
SolarWinds is strong on device performance, interface and volume monitoring, visual analysis, and expansion into other Orion modules. If you need to correlate a bandwidth spike with a path issue and then line that up with a config change, SolarWinds can do the job.
The compromises are familiar:
- Deep feature set: Excellent for complex environments.
- Forecasting cost is harder: Licensing by monitored elements takes planning.
- On-prem upkeep: You own the platform, patching, and scaling work.
Firewall logs often tell the real story before users can describe the problem clearly.
That's one reason I tell clients not to focus only on pretty dashboards. Exabeam notes that 52% of security professionals cite firewall logs as the most valuable data source for detecting anomalies. SolarWinds can bring a lot of signals together, but you still need an operations plan that turns alerts into action.
The official site is SolarWinds Network Performance Monitor. For a business-focused approach, this piece on monitoring network traffic to prevent downtime and improve ROI connects the technical side to the financial one.
5. Datadog Network Monitoring
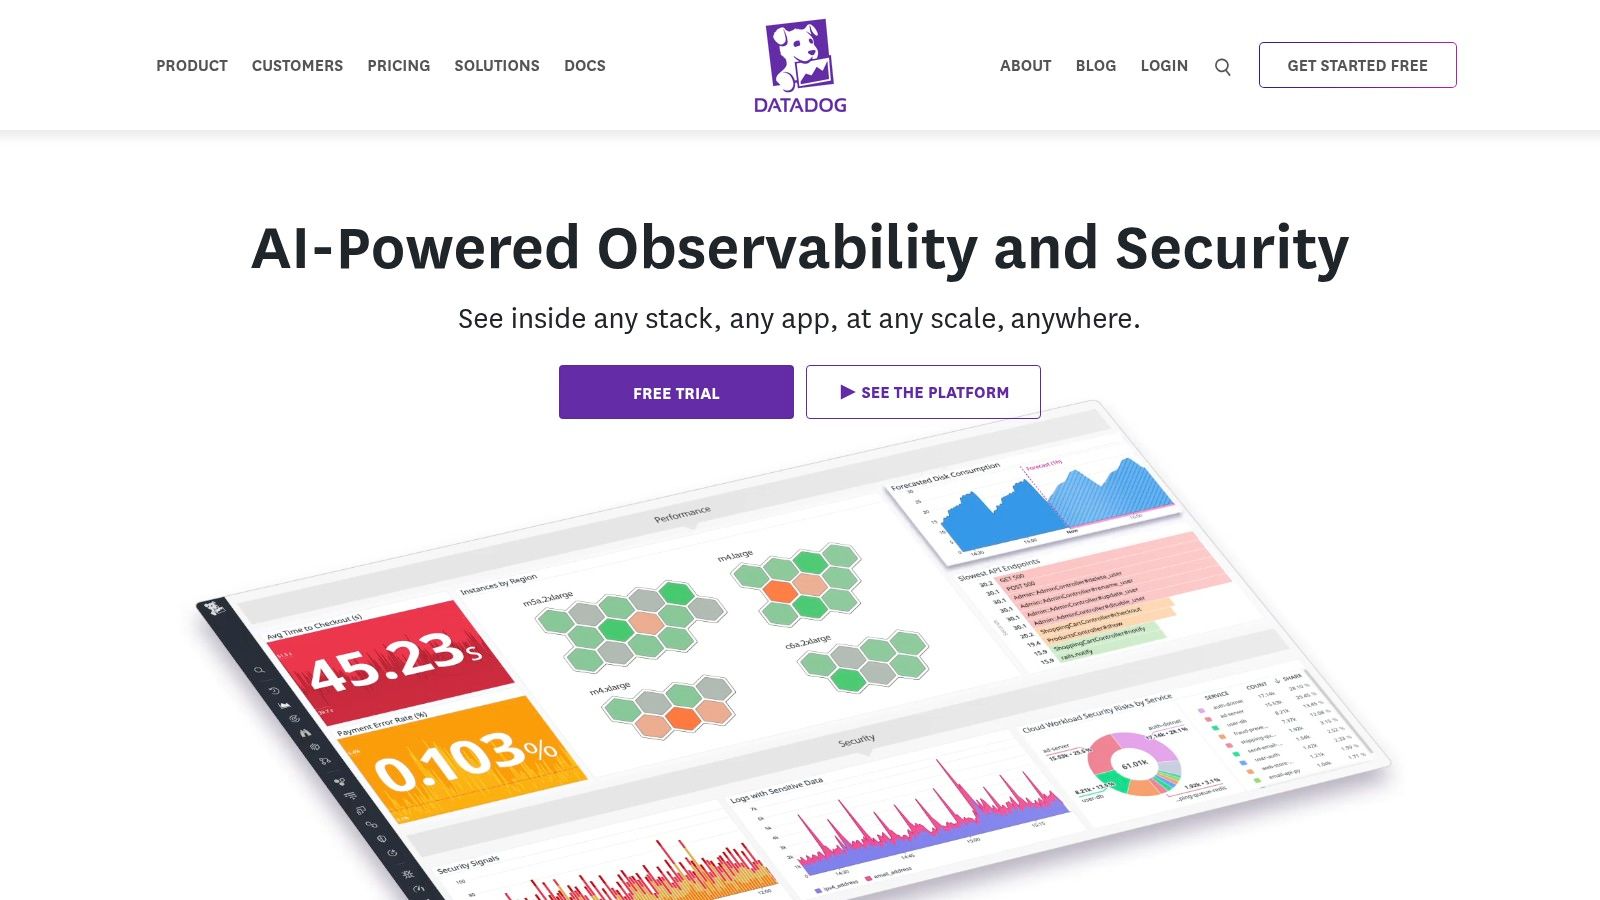
Datadog shines when the network is only part of the story. If your users live in cloud apps, your workloads sit across hybrid infrastructure, and your team already watches logs and application performance in one place, Datadog is a strong fit. It's less of a classic NMS and more of a unified observability platform that happens to do network monitoring well.
That distinction matters. A pure network admin may prefer a tool built around switches, routers, and flow first. A DevOps-leaning IT team may prefer correlating network issues directly with hosts, services, logs, and application traces.
Best fit for hybrid and cloud-first shops
Datadog offers cloud network monitoring, network device monitoring, and NetFlow analytics with modular pricing. That modular approach is useful. It's also how costs can climb if nobody keeps an eye on retention and ingest decisions.
What stands out:
- Published pricing model: Easier to start than quote-first vendors.
- Strong correlation: Network, infrastructure, logs, and applications live together.
- Agents and collectors required: Deployment planning still matters.
Datadog is especially useful for businesses with remote users, public cloud, and security layering that includes products like Bitdefender GravityZone, Zero Trust architecture, and SOC-as-a-Service monitoring. When cloud apps slow down, the question isn't just “is the switch healthy?” It's “where did the delay start?”
The official product site is Datadog. If your concern is where monitoring ends and security begins, this local article on what network security means for Indiana businesses gives the right frame.
6. LogicMonitor
LogicMonitor is one of the better answers for organizations that have outgrown “ping and pray.” It's cloud-based, handles hybrid infrastructure well, and does a good job of pulling network telemetry, topology, and traffic analysis into one operational view. For MSP-style operations and multi-site businesses, that's useful fast.
Its collector model is mature, and the platform supports SNMP, WMI, APIs, NetFlow, sFlow, IPFIX, and NBAR2. That means you can monitor traditional infrastructure, cloud-connected systems, and branch traffic without building a monitoring science project in the server room.
Where LogicMonitor earns its keep
This platform works well when your environment includes both old and new. A warehouse with old switching, a headquarters with virtual hosts, cloud apps for finance, and Wi-Fi complaints from a renovated downtown Indy building. LogicMonitor can tie those threads together better than simpler tools.
The issues to watch are straightforward:
- SaaS delivery: Less maintenance on your side.
- Strong multi-site support: Good for regional businesses with growth plans.
- Quote-based pricing: Smaller shops may feel the floor is high.
North America held a 42.30% share of the network monitoring market in 2025, according to Fortune Business Insights. That lines up with what we see locally. Businesses across the Indy metro aren't treating monitoring like a nice extra anymore. They're treating it like operating insurance.
7. Progress WhatsUp Gold

WhatsUp Gold doesn't try to be the coolest tool in the room. That's part of its appeal. It's on-prem, Windows-friendly, relatively straightforward to deploy, and easier for many SMBs to understand than sprawling enterprise suites. If a local business wants clear dashboards and predictable device-based licensing, this product deserves a look.
It does auto-discovery, interactive maps, device-based monitoring, alerting, reporting, wireless monitoring, and optional traffic analysis through add-ons. That last part is important. Like several tools in this tier, the base platform may be enough for health and availability, but deeper traffic analytics often live behind another purchase.
A practical SMB option
For Johnson County business owners with a stable, mostly on-prem environment, WhatsUp Gold can be the right size. It doesn't overwhelm smaller teams, and it gives enough visibility to catch overloaded links, unhealthy devices, and common wireless pain points.
A few trade-offs matter:
- Predictable device licensing: Easier for SMB budgeting.
- Quick deployment: Good for smaller IT teams.
- Add-on strategy: Advanced features can turn one purchase into several.
The official site is Progress WhatsUp Gold. I'd put it on the shortlist for businesses that want control without the overhead of a heavier platform, especially in offices where old cabling and old brick walls already create enough problems.
8. Zabbix

Zabbix is the best argument for open-source monitoring in SMB and midmarket environments. No license fees. Strong SNMP coverage. Agent checks, IPMI, JMX, scripts, templates, proxies, low-level discovery. If your team has Linux and database skills, Zabbix can do a lot.
If your team doesn't have those skills, Zabbix can become that one “free” system nobody wants to touch.
Why engineers like it
Zabbix gives control. You can tune templates, automate discovery, use proxies for scale, and shape the platform around your environment instead of adapting to a vendor's assumptions. That matters for specialized shops, manufacturers, and technical teams around Hamilton County growth areas that have in-house admin talent.
Zabbix also lines up with how modern monitoring is moving. Business Research Insights reports that AI-driven network monitoring adoption has reached 58% across enterprise environments. Zabbix itself is not a magic AI box, but its data collection depth gives skilled teams plenty to work with for automation and anomaly detection.
If you choose open source, budget time, Linux admin skill, and ownership. Otherwise the free license becomes expensive labor.
The vendor site is Zabbix. It's a strong choice when you want full control and you have the hands to run it.
9. Nagios XI

Nagios XI is old school in the best and worst ways. It's proven. It's extensible. It has a huge plugin ecosystem. It also feels older than newer SaaS platforms, and that means more admin effort. For some teams, that's fine. For others, it's a deal-breaker.
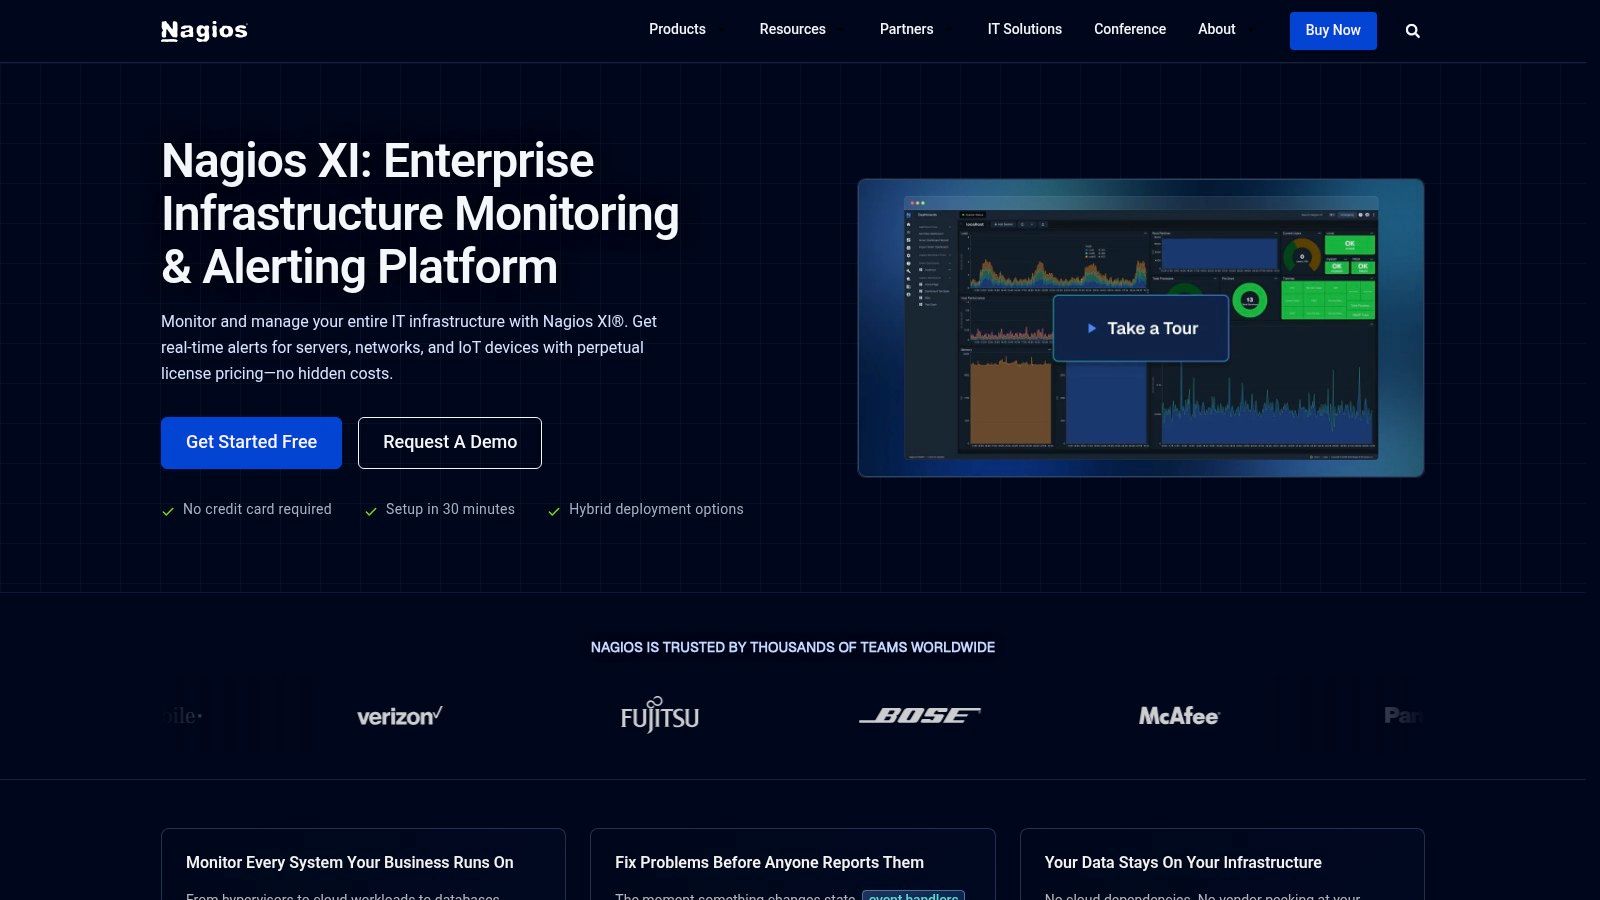
I still respect Nagios in environments where reliability, plugin breadth, and direct control matter more than polish. It's strong for SNMP checks, traps, service checks, dashboards, SLA and availability reporting, and role-based access. If you already know Nagios, XI can feel like home.
Where Nagios still makes sense
It works best for teams that want a commercial wrapper around a familiar core platform and don't mind putting in the time. It's also useful when perpetual licensing fits procurement better than ongoing subscription growth.
Here's the practical view:
- Big plugin ecosystem: Great for unusual gear and custom checks.
- Long-proven platform: Stable and familiar.
- Separate flow product: Deep traffic analytics usually means adding Nagios Network Analyzer.
Nagios Network Analyzer supports NetFlow, sFlow, J-Flow, and IPFIX collection, which is useful because flow visibility often separates “the internet is slow” from “one device is flooding the uplink.” The official site for the main platform is Nagios XI.
10. Managed IT Services & Support | Finchum Fixes IT
For a lot of Indiana SMBs, the best network monitoring tool isn't another dashboard. It's a managed service where somebody qualified is already watching, triaging, documenting, and fixing the issue before your staff loses half a day.
That's where Managed IT Services from Finchum Fixes IT fits. We run professional monitoring under the hood, pair it with rapid response, and tie it directly to business continuity. Instead of handing your office manager a monitoring login and wishing them luck, we translate alerts into action. Switch issue, firewall issue, Wi-Fi issue, endpoint issue, backup issue. It gets handled.
Why managed monitoring often has better ROI
A lot of businesses around Greenwood don't need “more visibility.” They need fewer interruptions. They need predictable monthly budgets, stronger security, and less wasted tech time. Monitoring only creates ROI when someone responds to it.
In our 17 years of local service, we've seen the same pattern. A company buys a capable tool, sets up some alerts, then ignores the noise because nobody owns it. Six months later, a failed backup, flapping switch port, or dying access point becomes an outage. That's not a tooling problem. That's an operations problem.
What we do differently:
- Proactive remediation: We don't just collect alerts. We act on them.
- Local certified team: Microsoft, CompTIA, and Cisco experience matters when the issue spans the firewall, the switch stack, and Microsoft 365.
- Security built in: Monitoring ties into Zero Trust architecture, SOC-as-a-Service monitoring, endpoint protection like Bitdefender GravityZone, and immutable off-site backups.
- Continuity mindset: We plan around RTO and RPO, not just device uptime.
When we dissembled a similar client's failing RAID array during a recovery job, the lesson was familiar. Monitoring and backup validation should've caught the warning signs earlier. Bit-level data recovery is expensive, stressful, and slow compared with preventing the incident in the first place.
There's also a modern blind spot many SMBs miss. Niagara Networks highlights that traditional monitoring tools can miss 40–60% of traffic in encrypted environments. That's a real problem for businesses running cloud apps, Zoom, Teams, and newer TLS-heavy workflows. We account for that with layered monitoring design, smarter log collection, and, where appropriate, newer telemetry approaches instead of pretending old packet inspection tells the whole story.
Good monitoring doesn't just show red lights. It tells the right person what broke, what changed, what users will feel, and what to fix first.
For Greenwood and Indianapolis businesses, the trade-off is simple. If you want hands-on control, buy the platform and staff it. If you want outcomes, use a managed service that owns the noise and the remediation.
Top 10 Network Monitoring Tools: Feature Comparison
| Solution | Core features (✨) | Quality & UX (★) | Pricing & Value (💰) | Target audience (👥) | Why choose / Unique (✨/🏆) |
|---|---|---|---|---|---|
| Auvik | ✨ Auto-discovery, L2/L3 topology, SNMP/WMI, TrafficInsights (add-on) | ★★★★ | 💰 Quote-based; TrafficInsights extra | 👥 MSPs & multi-site IT teams | ✨ Fast SaaS deployment; minimal on‑prem upkeep |
| Paessler PRTG | ✨ Sensor-based SNMP/WMI/flow, custom maps, remote probes | ★★★★ | 💰 Published sensor tiers; predictable if planned | 👥 SMBs wanting deep on‑prem control | ✨ Large sensor library & community |
| ManageEngine OpManager | ✨ SNMP/WMI/CLI, topology maps, dashboards, editions | ★★★★ | 💰 Edition/add-on complexity | 👥 Windows-centric IT teams | ✨ Broad base features + ManageEngine integration |
| SolarWinds NPM | ✨ Device perf, path visualization, PerfStack, Orion add-ons | ★★★★★ | 💰 Quote-based by elements; forecasting needed | 👥 Enterprises & complex networks | ✨ Deep, mature feature set; Orion ecosystem |
| Datadog Network Monitoring | ✨ Cloud network hosts, device monitoring, NetFlow analytics | ★★★★ | 💰 Granular published pricing; can scale costly | 👥 Cloud-first / hybrid teams | ✨ Unified app/infra/log correlation |
| LogicMonitor | ✨ SaaS collectors, topology, NetFlow/sFlow/IPFIX, NBAR2 | ★★★★ | 💰 Quote-based; higher minimums possible | 👥 MSPs & multi-site enterprises | ✨ Strong multi-tenant & dynamic discovery |
| Progress WhatsUp Gold | ✨ Auto-discovery, device-based monitoring, NTA add-on | ★★★ | 💰 Predictable device-based licensing | 👥 SMBs seeking simple on‑prem tools | ✨ Quick Windows-friendly deployment |
| Zabbix | ✨ SNMP/agents/auto-discovery, templates, proxies for scale | ★★★ | 💰 Free core (support subscriptions optional) | 👥 Linux-skilled teams & DIY shops | ✨ No license fees; highly extensible |
| Nagios XI | ✨ SNMP/service checks, dashboards, plugin ecosystem | ★★★ | 💰 Perpetual licensing + renewals | 👥 Organizations needing extensibility | ✨ Huge plugin library; proven reliability |
| 🏆 Finchum Fixes IT Managed Services | ✨ Proactive monitoring, automated remediation, 24/7 support | ★★★★★ | 💰 Managed subscription; predictable outcomes | 👥 Indiana SMBs & midsize orgs | 🏆 Local certified team, fast response (<2 hrs), fully managed, no extra dashboards |
Stop Guessing, Start Monitoring. Get Your Free Network Assessment
The tool matters. The operating model matters more.
A strong monitoring platform can detect bandwidth spikes, latency, packet loss, device health issues, and outages before they turn into business interruptions. TierPoint explains that network monitoring supports proactive detection by continuously analyzing real-time bandwidth use, latency, CPU and memory usage, and packet loss. That's the technical side. The business side is what happens next.
If nobody reviews alerts, tunes thresholds, checks backup success, correlates firewall logs, and validates failover paths, you're still one bad morning away from downtime. The whole point of network monitoring tools is to move from reactive panic to proactive prevention. Navas describes that shift well in its piece on network monitoring and business continuity. That's exactly how Indiana SMBs should think about this.
The financial side is just as real. BCM Metrics lays out a direct formula for calculating downtime cost from lost revenue and lost productivity. You don't need a finance degree to see the pattern. Every hour your team can't work, every stalled invoice, every missed job ticket, every failed checkout, and every delayed client response eats margin. Monitoring helps convert wasted tech time back into productive hours and steadier monthly spending.
That matters even more as adoption rises. MarketsandMarkets projects the network monitoring market will grow from $3.56 billion in 2023 to $10.23 billion by 2028 at a 23.5% CAGR. You don't need to care about market forecasts for their own sake. You should care because they reflect what business owners already know. Networks are now business systems. If the network wobbles, everything above it wobbles too.
Another sign of the shift is how security and compliance are moving into the same conversation. SNS Insider reports that the global Network Monitoring Technology Market was valued at USD 2.78 billion in 2025, with security monitoring tools generating over 38% of the monitoring tools segment market share in 2024. That tracks with what we see around Greenwood, downtown Indy, and the broader metro. HIPAA, CMMC, and NIST CSF concerns aren't separate from uptime anymore. They're tied together.
If you're a business owner in Greenwood or the greater Indianapolis area, you probably have better things to do than tune SNMP polling, sort through syslog noise, or build latency-optimized mesh nodes for a stubborn office layout. That's our job. We use enterprise-grade monitoring, networking, cybersecurity, cloud support, software troubleshooting, and data recovery practices to keep local businesses running cleanly and securely.
If your business is in Greenwood, Indianapolis, or anywhere along the south side and I-65 corridor, Finchum Fixes IT can help you stop guessing about network problems and start fixing them before they become outages. Schedule a Free Network Assessment or Security Risk Audit, and we'll identify bottlenecks, blind spots, compliance concerns, and practical next steps for a more reliable network.